
|
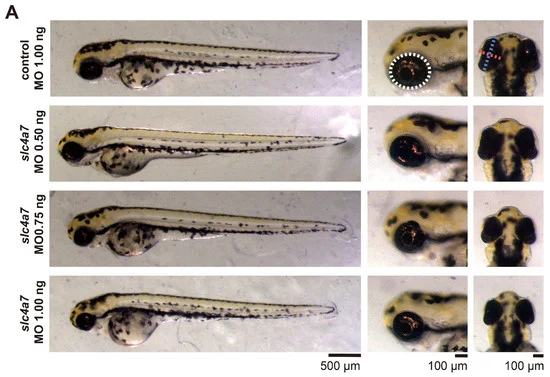
Fig. 2 Slc4a7-deficient zebrafish morphants exhibited marked ocular changes. (A) Whole-body view (scale bar = 500 μm), lateral view (scale bar = 100 μm), and vertical view (scale bar = 100 μm) of zebrafish larvae at 3 dpf. The ocular area is indicated by white circles. The ocular axis is indicated by a red dashed line. The equatorial axis is indicated by a blue dashed line. (B–E) The measurement of ocular axis length, equatorial length, ocular area, and the ratio of ocular length to body length. n = 25 in each group. Bar plots are shown as the mean ± s.e.m. Data were analyzed using one-way ANOVA followed by Tukey’s post hoc tests, *** p < 0.001, and **** p < 0.0001 indicate significant differences from the control 1.00 ng group. The scattered circles, squares, and triangles of various colors in the bar chart denote individual values of zebrafish eye-related parameters for different groups.