
|
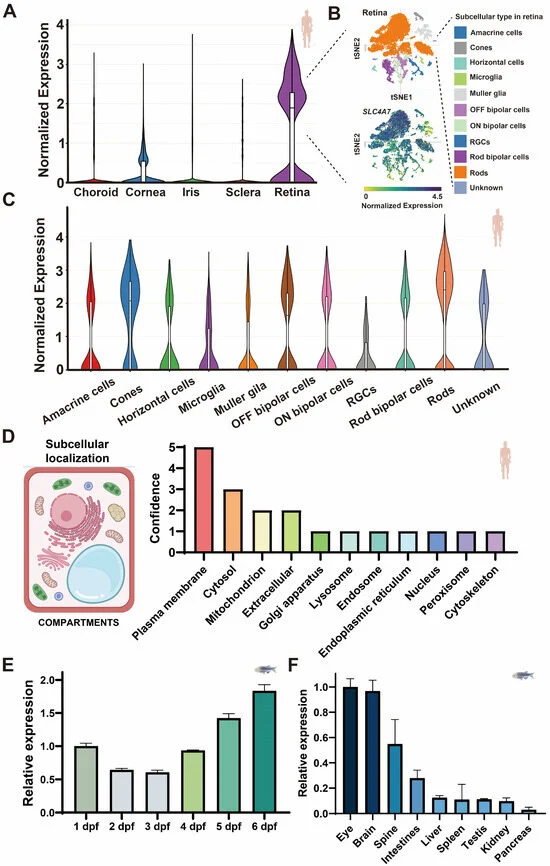
Fig. 1 The expression profile of SLC4A7 (slc4a7) in both humans and zebrafish. (A) Profiling of human single-cell RNA sequencing unveils SLC4A7 expression in various ocular tissues, including the retina, cornea, iris, sclera, and choroid. (B) Single-cell transcriptome profiling and SLC4A7 gene signatures of the human retina. The upper tSNE plot showing major cell subsets in human retina. The lower tSNE plot of all cells colored by enrichment of SLC4A7 gene signatures. (C) Detailed expression pattern of SLC4A7 across various cell types in the human retina. (D) Human subcellular localization of SLC4A7 provided by COMPARTMENTS. (E,F) qRT-PCR display the time series (E) and the tissue-specific (F) expression pattern of slc4a7 in zebrafish larvae. Bar plots are shown as the mean ± std. Label of human and zebrafish indicating the species source of the data. The normalized expression values refer to the standardized measure of gene expression levels across different cells or cell types in a single-cell RNA sequencing dataset, as calculated and provided by the online analysis tool, Single Cell Portal. The relative expression values were calculated relative to the expression of the reference gene β-actin. The dashed lines indicate detailed information about the corresponding tissues or figures. Human or zebrafish icons indicate the species origin of the data.