
|
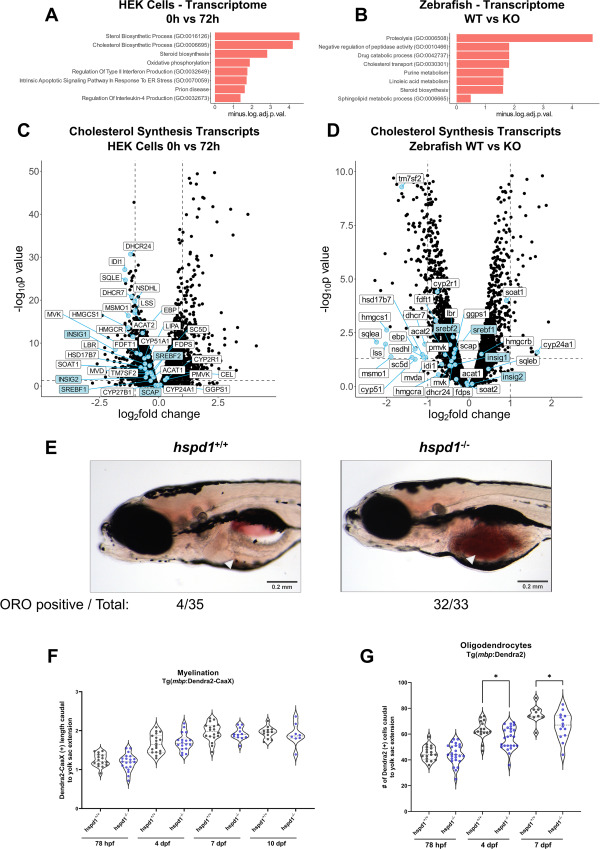
Fig. 6 Zebrafish Hsp60 knockout larvae have altered lipid metabolism and oligodendrocyte counts (A–B) Enrichment analysis of differentially expressed genes of D423A cells at 0 h in comparison to 72 h (A) and in 5 dpf hspd1−/− larvae in comparison to hspd1+/+ larvae (B). Performed on EnrichR at gene name level for proteomics and transcriptomics, GO biological process and KEGG terms are included. The enriched terms are shown as a negative log10 of adjusted p-values. Adjusted p-values <0.05 were considered significant. (C–D) Volcano plots showing the transcriptomic regulation of genes involved in cholesterol synthesis pathways in D423A cells induced for 72 h (C) and in 5 dpf hspd1−/− larvae (D). Cholesterol synthesis genes and regulators are displayed as blue points; the labels for the regulating system genes are shaded in blue. (E) Whole-mount Oil Red O staining of 8 dpf zebrafish larvae shows lipid accumulation and altered lipid composition in the yolk of hspd1−/− larvae compared to hspd1+/+ larvae. (F) The length of Dendra2-CaaX(+) signal was measured caudal to yolk sac extension at 78 hpf, 4 dpf, 7 dpf, and 10 dpf. Larvae were generated from hspd1+/− to Tg(mbp:Dendra2-CaaX) mating. (G) The number of mature oligodendrocytes was quantified as caudal to yolk sac extension Dendra2-positive cells at 78 hpf, 4 dpf, and 7 dpf. Larvae were generated from hspd1+/− to Tg(mbp:Dendra2) mating. Abbreviations: TCA, tricarboxylic acid; GO, gene ontology; KEGG, Kyoto Encyclopedia of Genes and Genomes. See also Figure 1 , Figure 2 , Figure 4 .