
|
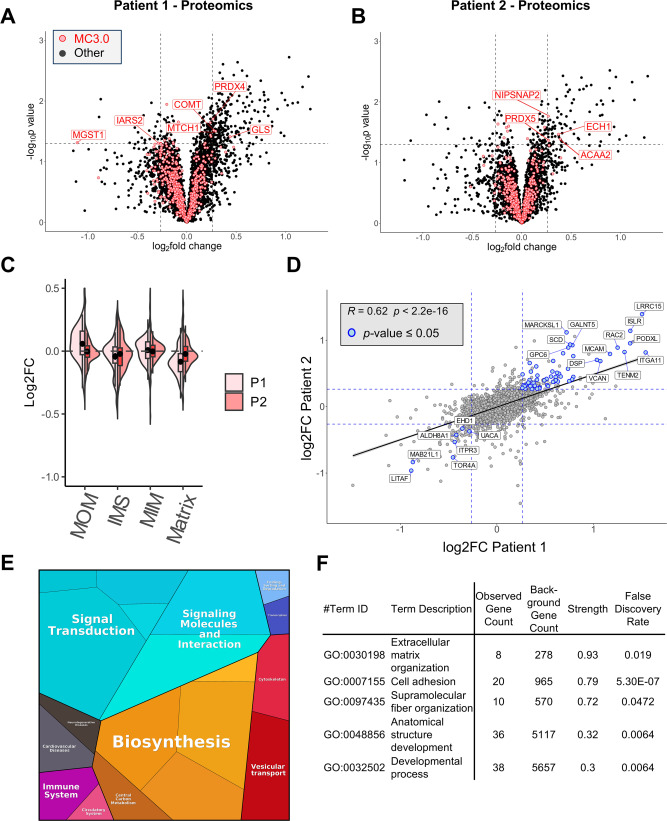
Fig. 3 Proteomics analysis of patient fibroblasts carrying HSP60 disease-associated variants (A–B) Volcano plots showing the quantified proteome of human dermal fibroblasts of the Patient 1 (heterozygous HSP60-p.Leu47Val) (A) and of human dermal fibroblasts of the Patient 2 (homozygous HSP60-p.Asp29Gly) (B) compared to their respective human dermal fibroblast control cells (n = 3). P values were calculated using TDIST function in Excel. Cut-off values are indicated with dashed lines (p-value <0.05 and |log2FC|>0.26). Mitochondrial proteins based on MitoCarta3.0 (MC3.0; [ 2 ]) are highlighted with red points. (C) Violin plot distinguishing the mitochondrial sub-compartment protein Log2fold changes from dermal fibroblasts from Patient 1 (light red) and Patient 2 (dark red) in comparison to their respective controls. (D) Correlation of the protein Log2fold changes of Patient 1 (horizontal axis) with Patient 2 (vertical axis) in comparison to their respective controls. Points for significantly changed genes with p-values ≤ 0.05 are displayed as blue points. The correlation line is based on a linear mode; Pearson R and p values are given. (E) Functional categories of differentially expressed proteins in fibroblasts of Patient1 and Patient2 as compared to control fibroblasts illustrated by using Proteomaps [ 61 ] ( https://proteomaps.net ). Polygons correspond to KEGG pathway groups, and the sizes correlates are scaled according to the absolute values of average log(2) fold changes. (F) Enriched GO terms for significantly up-regulated fibroblast proteins in Patient 1 and Patient 2 is analyzed using the STRING database [ 62 ] ( https://string-db.org ). Proteomaps and Enrichment analyses were performed on False Discovery Rate (FDR)-corrected (FDR<0.05) values with |log2FC|>0.26.