
Fig. 7
|
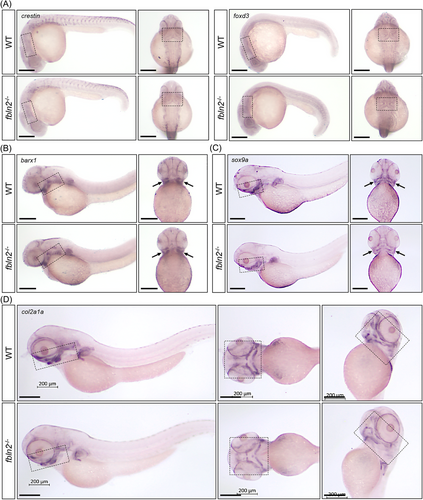
Fig. 7 WISH analysis of the effect of fbln2 knockout on cranial neural crest cell (CNCC) development. (A) At 24 h post fertilization (hpf), the expression of the neural crest cell markers crestin (left) and foxd3 (right) is similar in wild type and fbln2−/− embryos (marked by black dashed rectangles, magnification factor: 4×, n = 30 per group, bar = 200 μm). (B) At 48 hpf, the prechondral condensation marker barx1 is expressed similarly (magnification factor: 4×, n = 30 per group, bar = 200 μm) between wild type and fbln2−/− embryos. The pharyngeal arches are shown in black dashed rectangles in the lateral view and black arrows in the ventral view. (C) CNCC chondrogenic differentiation is impaired by fbln2 knockout as demonstrated by the reduced expression of the marker of CNCC differentiation, sox9a, at 72 hpf in fbln2−/− embryos (magnification factor: 4×, n = 30 per group, bar = 200 μm). The mandibular region is marked by black dashed rectangles in the lateral view, and black arrows in the ventral view. (D) At 72 hpf, the expression of the mature chondrocyte marker col2a1a is reduced significantly in the mandible of fbln2−/− embryos (marked by black dashed rectangles, magnification factor: 4×, n = 30 per group, bar = 200 μm). Abbreviation: WT, wild type.