
|
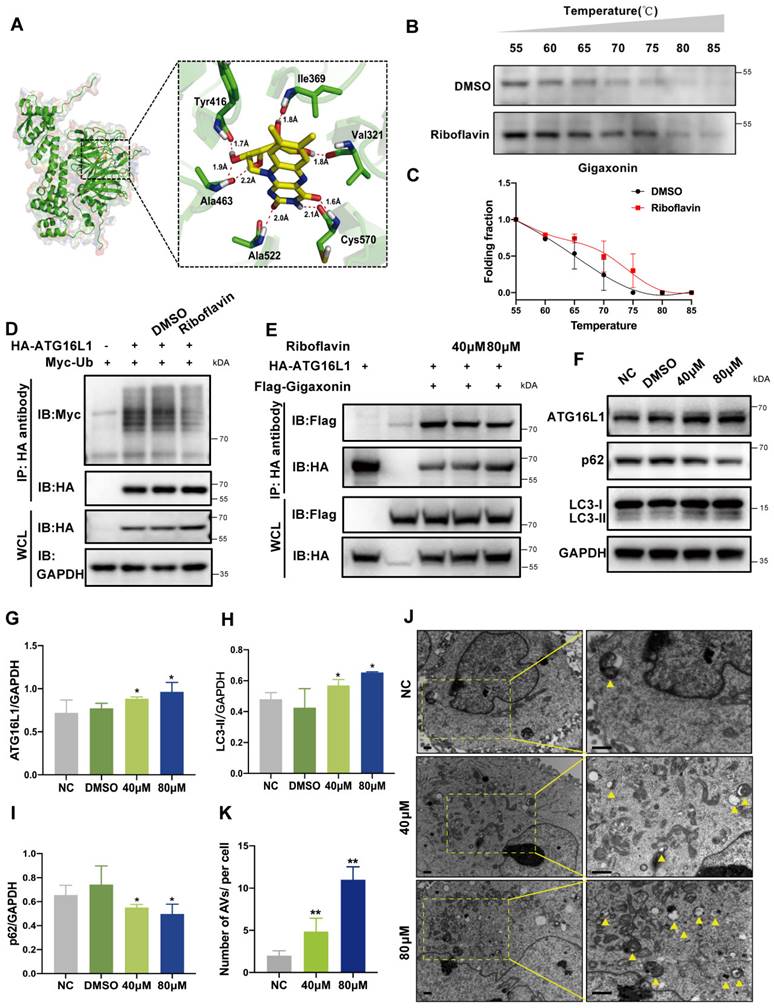
Fig. 6 Identification of Riboflavin, a potential ATG16L1 ubiquitination regulator. (A) Modeling of riboflavin docking superimposed on gigaxonin, with the interacting gigaxonin amino acids represented by green sticks. (B) Cellular thermal shift assay of gigaxonin with riboflavin. (C) gigaxonin melting curves, n = 3. (D-E) HEK293 cells were transfected with indicated plasmids for 24 h; then, the cells were treated with DMSO or riboflavin for another 24 h. Western blots of immunoprecipitates with HA affinity gels. (F) Western blots of ATG16L1, LC3, and p62 protein levels in HLE cells treated with DMSO or riboflavin (40 µM and 80 µM), n = 3. (G-I) Quantification of ATG16L1, LC3, and p62 levels, n = 3 (Mann-Whitney test). (J-K) Electron micrographs of HLE cells and quantification of AVs per cell. Yellow arrows indicate autophagic vacuoles. ≥ 8 cells per experiment, scale bar: 1 µm. Mean ± SD, *p < 0.05, **p < 0.01(Mann-Whitney test).