
|
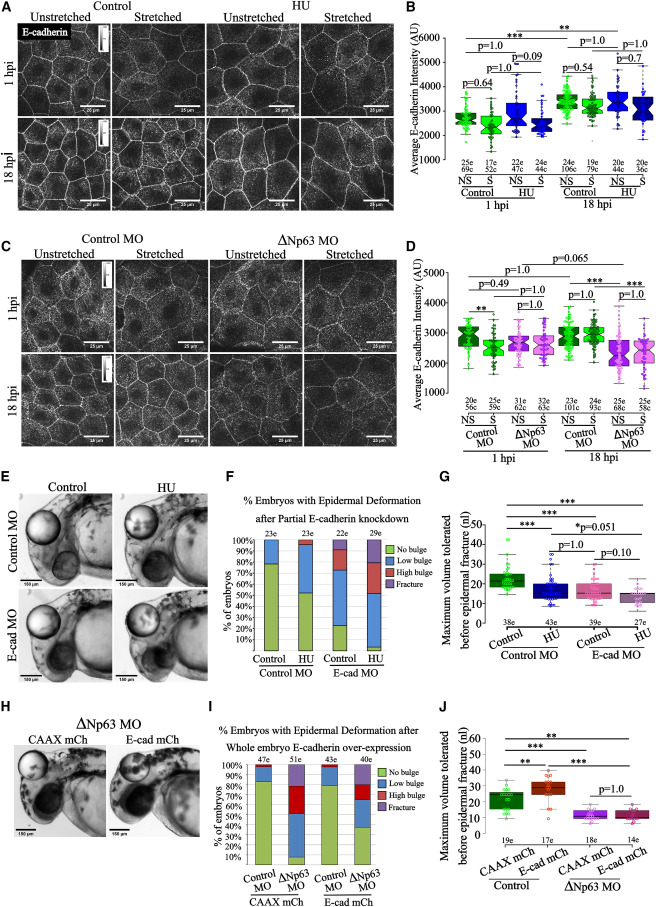
Fig. 3 E-cadherin-mediated adhesion strengthens the epidermis under chronic stretch (A–D) Confocal micrographs (A and C) and boxplots (B and D) showing E-cadherin fluorescence intensity in a.u. at 1 and 18 hpi. (A)–(D) show the changes in junctional E-cadherin under HU treatment (A and B) and ΔNp63 MO (C and D). Quantification and statistical analyses were performed using n = the total number of cells collected from multiple embryos, as indicated below graphs (e, embryos; c, cells). (E, F, H, and I) Bright-field images of oil-injected zebrafish embryo heads showing epidermal deformation phenotypes (E and H) and qualitative assessment of extent of deformation (see STAR Methods and Figure S4Aa) (F and I) in HU-treated e-cadherin morphant (E-cad MO) embryos along with appropriate controls at 12 hpi (E and F) and ΔNp63 morphants (ΔNp63MO) upon mCherry-tagged CAAX (CAAX mCh) or E-cadherin (e-cad mCh) injection (H and I). (G and J) Boxplots represent the amount of injection volume tolerated in the acute stretch paradigm by HU-treated e-cadherin morphant embryos along with appropriate controls (G) and the control and ΔNp63 morphant embryos injected with CAAX-mCherry and e-cadherin-mCherry RNA (J). Quantification and statistical analyses were performed using n = the total number of embryos collected from multiple sets, as indicated below graphs (e, embryos). In the boxplots, center lines depict medians, while box limits indicate the 25th and 75th percentiles as determined by R software; whiskers extend 1.5 times the interquartile range from the 25th and 75th percentiles; notches in the boxplot are defined as ±1.58 × IQR/sqrt(n). Scale bars: 25 μm (A and C) and 150 μm (E and H). Calibration bars: 0–1,500 a.u. (A) and 0–1,250 a.u. (C). hpi, hours post-injection; NS, no stretch; S, stretched. ∗p < 0.05, ∗∗p < 0.01, and ∗∗∗p < 0.001 by Kruskal-Wallis test with Dunn’s post hoc test. We consider ∗p = 0.051 as a statistically significant difference.