IMAGE

Figure 6

ID
ZDB-IMAGE-240620-280
Source
Figures for Aranda-Martínez et al., 2024
Image
Figure Caption

Figure 6

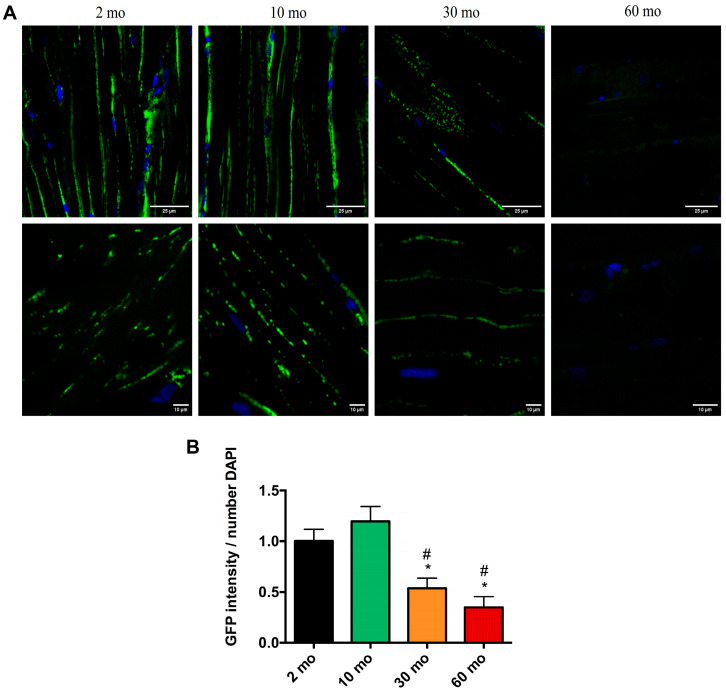
Loss of mitochondria with age. (A) Confocal microscopy images showing the nuclei labeled with DAPI and the mitochondria with GFP in the 2-, 10-, 30-, and 60-month groups. (B) The fish at 2 and 10 months exhibited a high GFP intensity, which decreased significantly at 30 and 60 months. Data are presented as mean ± SEM (n = 4 animals/group). * p < 0.05 vs. 2 mo; # p < 0.05 vs. 10 mo. Unpaired t test.

Acknowledgments
This image is the copyrighted work of the attributed author or publisher, and ZFIN has permission only to display this image to its users. Additional permissions should be obtained from the applicable author or publisher of the image. Full text @ Int. J. Mol. Sci.