IMAGE

Fig. 2

ID
ZDB-IMAGE-240405-47
Source
Figures for Zhang et al., 2024
Image
Figure Caption

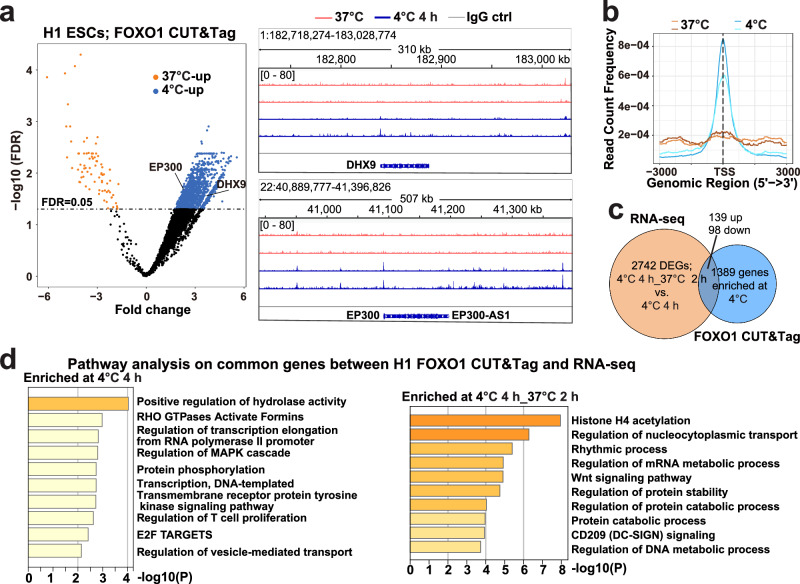
Fig. 2 Temperature-induced differential FOXO1-DNA binding and transcriptomic changes in H1 ESCs.

a Left: fold change vs. -log10 FDR-corrected Q-value for differential FOXO1-binding at 37 °C or 4 °C 4 h in H1 ESCs revealed by CUT&Tag-seq; right: IGV (Integrative Genomics Viewer) snapshots showing FOXO1-binding signals around the DHX9 and EP300 loci (right); kb, kilobase pairs. b Line plots summarizing the mean of FOXO1 CUT&Tag signals within 3 kb up- and down-stream of gene transcription start sites (TSS) in H1 ESCs at 37 °C and 4 °C 4 h; kb, kilobase pairs. c Venn diagram indicating the overlap between differentially expressed genes (DEGs) upon rewarming and 4 °C-induced FOXO1 differentially bound genes in H1 ESCs. d Enrichment analysis on the overlapped genes from (c); left: Enrichment analysis on genes that had higher levels of transcripts at 4 °C 4 h compared to 4 °C 4 h_37 °C 2 h (rewarmed); right: Enrichment analysis on genes that had higher levels of transcripts at the rewarmed stage compared to 4 °C 4 h. P values in (d) were calculated in Metascape.

Acknowledgments
This image is the copyrighted work of the attributed author or publisher, and ZFIN has permission only to display this image to its users. Additional permissions should be obtained from the applicable author or publisher of the image. Full text @ Nat. Commun.