
|
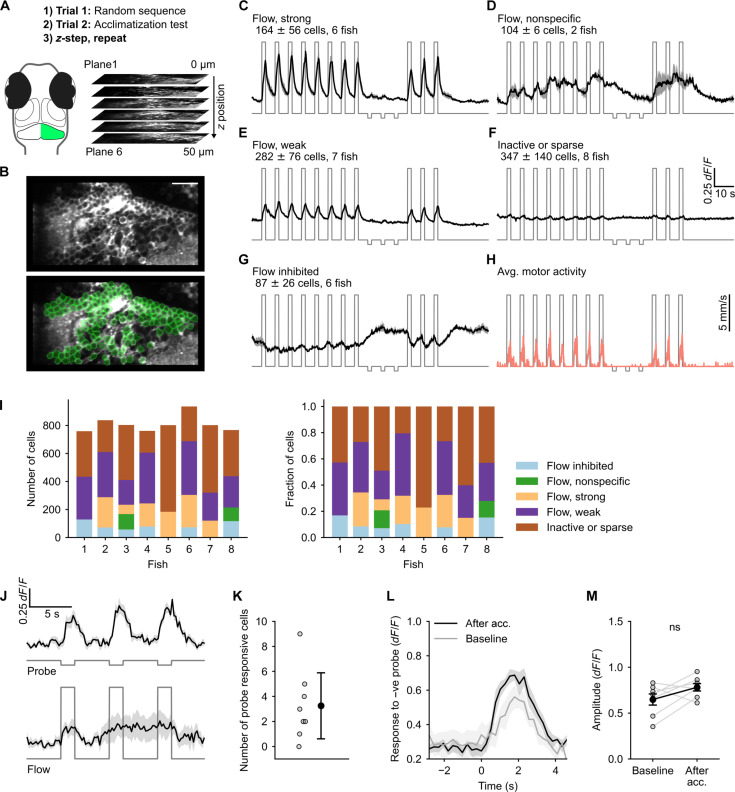
Fig. 6 Granule cell (GC) responses reveal absence of the error signal. (A) Schematic of the experimental protocol. (B) A representative imaging plane (top) and regions of interest (ROIs) drawn around GC cell bodies using semiautomated anatomical segmentation (bottom). Scale bar, 20 μm (C to G) Functional response types identified using correlation-based clustering. The cluster label, the number of cells (means ± SD), and the number of fish in which the cluster was found are inset in each panel. (H) Average motor activity overlaid on the optic flow stimulus trace. (I) The number and relative proportions of GCs in each cluster across fish. (J) Top: Response of probe responsive cells identified using cross-correlation with stimulus regressor. Bottom: Response of the same cells shown on top to optic flow at 1 cm/s. (K) Number of cells identified as probe responsive. (L) Average response of the probe responsive cells to negative probe pulses after acclimatization and when presented at random (baseline). (M) Response amplitude of the probe responsive cells to negative probe when presented randomly compared to the amplitude after acclimatization. ns, P = 0.11 by Wilcoxon signed-rank test. Traces shown in (C) to (H), (J), and (K) are means ± SEM.