
|
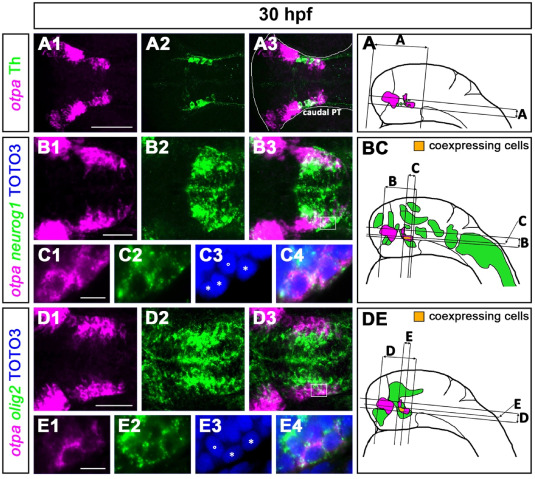
Fig. 7 neurog1 and olig2 are coexpressed with otpa. (A1-A3) otpa mRNA expression relative to Th protein expression. (B1–C4) co-expression of otpa (magenta) and neurog1 (green). (D1-E4) co-expression of otpa (magenta) and olig2 (green). (C1–C4) is a magnification of the corresponding highlighted area of a different embryo in (B3/BC), (E1-E4) of the corresponding highlighted area of a different embryo in (D3/DE). The white line in (A3) frames the outline of the imaged zebrafish larval head and eyes. (C3,4) and (E3,4) show TOTO3 nuclear stain. (A, BC, DE) Schemes show lateral head views of 30 hpf zebrafish larvae with schematic expression patterns of stained mRNAs and proteins and indicate approximate positions of planes and projections. Areas with coexpression are colored in orange. Abbreviations: PT, posterior tuberculum. All images show dorsal views. (C1–C4, E1-E4) show single confocal planes; (A1-B3, D1-D3) are 30–40 μm maximum intensity projections. Anterior is to the left. Scale bars: (A) 100 μm, (B,D) 50 μm, (C,E) 10 μm.
Reprinted from Developmental Biology, 505, Altbürger, C., Rath, M., Armbruster, D., Driever, W., Neurog1 and Olig2 integrate patterning and neurogenesis signals in development of zebrafish dopaminergic and glutamatergic dual transmitter neurons, 859885-98, Copyright (2023) with permission from Elsevier. Full text @ Dev. Biol.