
|
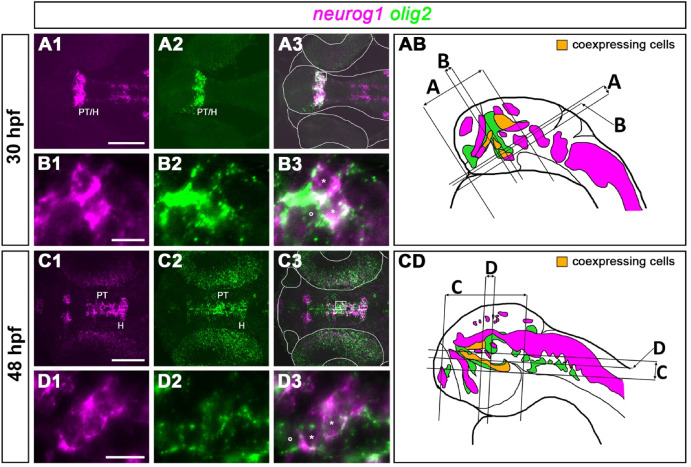
Fig. 4 neurog1 and olig2 are coexpressed in defined domains during development. (A1-D3) Co-expression of neurog1 (magenta) and olig2 (green) at (A1-B3) 30 hpf and (C-D3) 48 hpf. (B1–B3) is a magnification of the corresponding highlighted area of a different embryo in (A3/AB), (D1-D3) of the corresponding highlighted area of a different embryo in (C3/CD). The white line in (A3) frames the outline of the imaged zebrafish larval head, neural tube and eyes; the line in (C3) frames the outline of the imaged zebrafish larval head, nose pits and eyes. At both stages some cells show coexpression of neurog1 and olig2 (B3,D3, asterisks). (AB, CD) Schemes show lateral head views of 30 and 48 hpf zebrafish larvae with schematic expression patterns of stained mRNAs and indicate approximate positions of planes and projections. Areas identified to express both genes are colored in orange (see also Supplemental Movies 1, 2). Abbreviations: H, hypothalamus; PT, posterior tuberculum. All images show dorsal views. (B1–B3,D1-D3) show single planes; (A1-A3,C1–C3) are 20–40 μm maximum intensity projections. Anterior is to the left. Scale bars: (A,C) 100 μm, (B,D) 10 μm.
Reprinted from Developmental Biology, 505, Altbürger, C., Rath, M., Armbruster, D., Driever, W., Neurog1 and Olig2 integrate patterning and neurogenesis signals in development of zebrafish dopaminergic and glutamatergic dual transmitter neurons, 859885-98, Copyright (2023) with permission from Elsevier. Full text @ Dev. Biol.