
Fig. 2
- ID
- ZDB-IMAGE-240226-13
- Publication
- Baek et al., 2022 - Single-cell transcriptome analysis reveals three sequential phases of gene expression during zebrafish sensory hair cell regeneration
- All Figures
- Figures for Baek et al., 2022
|
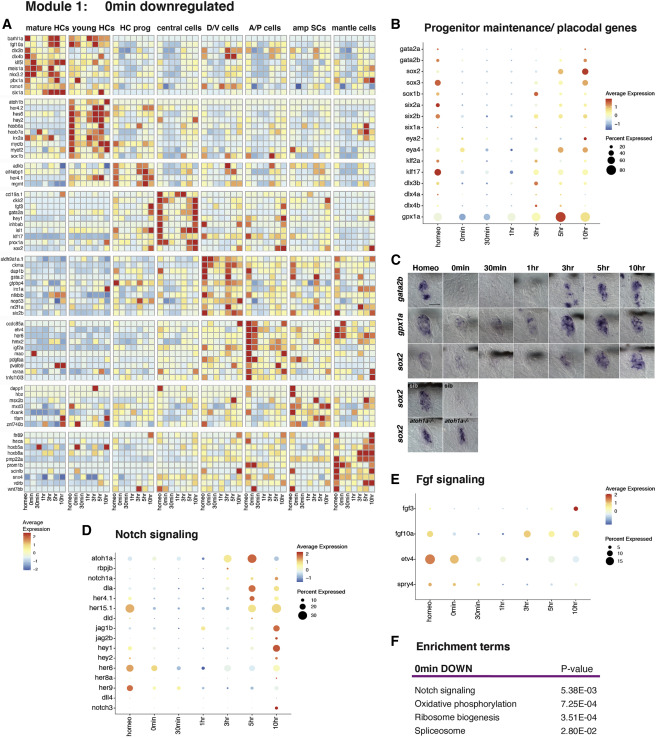
Fig. 2 Downregulation of progenitor maintenance/ placodal genes, Notch, and Fgf signaling 0 min after HC death (A) Heatmap of selected cell-type-specific downregulated genes 0 min after neomycin treatment. (B) Dot plot of the average expression of progenitor/stem cell maintenance/placodal genes during HC regeneration. The size of the dots represents the proportion of cells expressing the gene. (C) ISH images of gata2b, gpx1a, and sox2 expression during HC regeneration. Bottom two rows: ISH of sox2 in siblings and atoh1a CRISPR mutants during homeostasis and 0 min after neomycin treatment. Scale bar, 20 μm. (D and E) Dot plots of the average expression of Notch (D) and Fgf (E) pathway members during HC regeneration. (F) Enrichment term analysis of downregulated genes 0 min after HC death compared with all other time points.
Reprinted from Developmental Cell, 57(6), Baek, S., Tran, N.T.T., Diaz, D.C., Tsai, Y.Y., Acedo, J.N., Lush, M.E., Piotrowski, T., Single-cell transcriptome analysis reveals three sequential phases of gene expression during zebrafish sensory hair cell regeneration, 799-819.e6, Copyright (2022) with permission from Elsevier. Full text @ Dev. Cell