
Fig. 5
- ID
- ZDB-IMAGE-240126-32
- Publication
- Takesono et al., 2023 - Zinc oxide nanoparticles disrupt development and function of the olfactory sensory system impairing olfaction-mediated behaviour in zebrafish
- All Figures
- Figures for Takesono et al., 2023
|
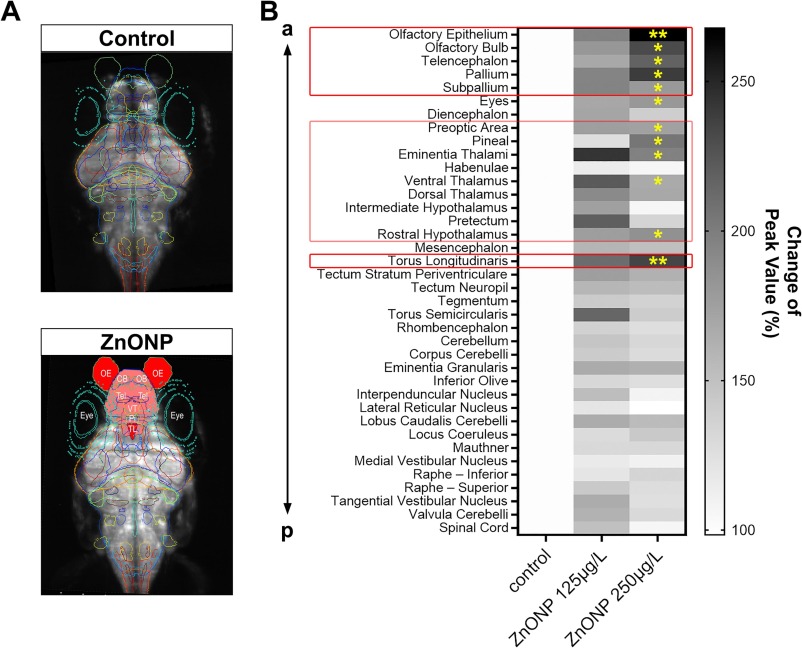
Fig. 5 ZnONP exposure alters the intrinsic neuronal activity predominantly in forebrain regions linked with odour processing. (A) LSM images of elavl3:GCaMP6s zebrafish embryo brain (dorsal view) of control (top) and ZnONP (250 μg/L) exposed embryos (bottom) (see details in Methods). Each coloured line in the images represents a brain region of interest (ROI). ROIs whose GCaMP activity is activated by ZnONP are coloured with red gradients (based on the data in Fig. 5B). Olfactory epithelia, OE; olfactory bulb, OB; Telencephalon, Tel; Ventral Tharamus, VT; Pineal, Pi; Torus Longitudinalis, TL. (B) Heat map displaying changes (%) of GCaMP signals in 37 different brain regions. The order of ROIs represents the location of a ROI along the anterior-posterior (a-p) axis (top–bottom). ROIs with a significant increase in the intrinsic neuronal activity are marked with red rectangles. Forebrain regions, I; mid-brain (diencephalon) regions, II; and Torus Longitudinaris, III. * p < 0.05, ** p < 0.01 by mixed effect generalised linear model in R. N = 7–9. (For interpretation of the references to colour in this figure legend, the reader is referred to the web version of this article.)