
Fig. 3
- ID
- ZDB-IMAGE-240126-30
- Publication
- Takesono et al., 2023 - Zinc oxide nanoparticles disrupt development and function of the olfactory sensory system impairing olfaction-mediated behaviour in zebrafish
- All Figures
- Figures for Takesono et al., 2023
|
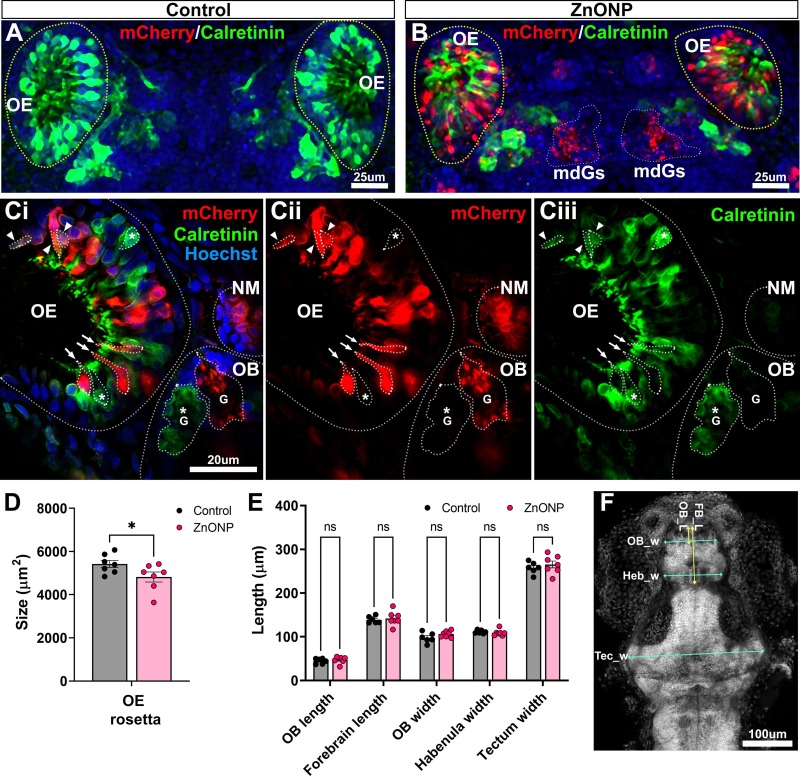
Fig. 3 ZnONP exposure primarily triggers OS responses in calretinin-negative OSNs. (A-B) Confocal images of a microvillous OSN marker, calretinin, positive OSNs (green) and mCherry expressing OS responding OSNs (red) in the OE and OB: A, control; B, ZnONP (1 mg/L) exposed EpRE:mCherry embryo-larvae. The outlines of the OE, yellow dotted lines; OS responding OSN projections at mdGs, white dotted lines in B; the nuclei, Hoechst staining (blue). (Ci-Ciii) The optical section image (0.5 μm step size) of OS responding (Cii, mCherry) and calretinin expressing (Ciii, green) OSNs in ZnONP (1 mg/L) exposed EpRE:mCherry embryo-larvae. neuromast, NM; glomerulus, G; mCherry (red) + OSNs, white arrows; calretinin (green) + OSNs, white asterisks; mCherry+/calretinin + double positive OSNs, white arrow heads; the nuclei, Hoechst staining (blue). (D) The measurement of OE rosette area size, and (E) brain region length, n = 7. Mean ± SEM with individual plots shown. (F) The representative positions of the measurements used for E: the lengths, yellow both-end arrows; the widths, cyan both-end arrows. * p < 0.05, by t-test in D; ns (not significant) by ANOVA with Sidak’s post hoc test using GraphPad Prizm version 9.3.1. (For interpretation of the references to colour in this figure legend, the reader is referred to the web version of this article.)