IMAGE

Fig. 1

ID
ZDB-IMAGE-240116-7
Source
Figures for Yamamoto et al., 2024
Image
Figure Caption

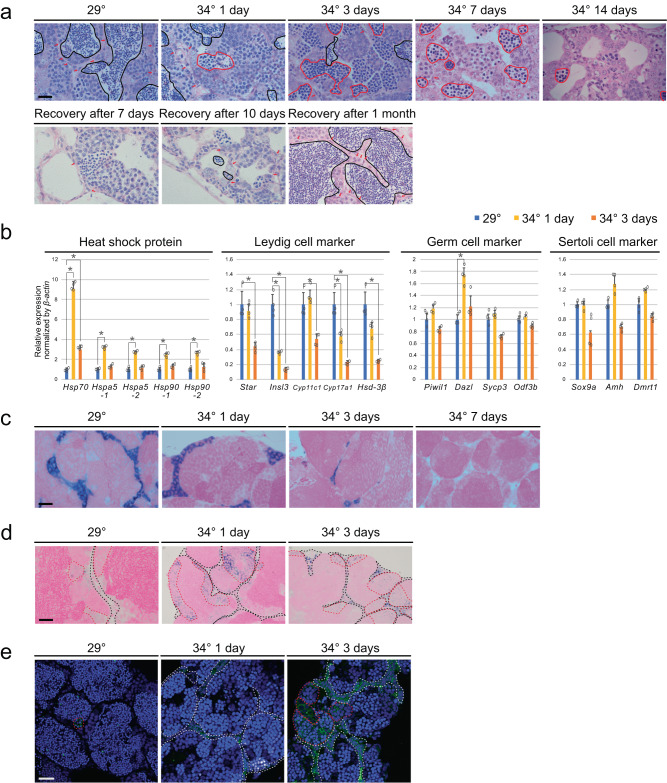
Fig. 1 High-temperature treatment led to significant apoptosis of Leydig cells.

a Top row: HE staining of testes. The black lines indicate areas containing E3 spermatid. The red lines indicate areas containing abnormal cell populations. Arrows indicate interstitial tissue. Interstitial areas decreased at 3, 7, and 14 days of temperature stimulation. Bottom row: Recovery of spermatogenesis and interstitial areas from temperature stimulation. The abnormal cell population disappeared, and E3 spermatid and interstitial areas were observed. b qRT-PCR analysis in testes. Values are the mean ± SEM (n = 4). *p < 0.01 compared with the 29 °C testes. c In situ hybridization of Insl3, a Leydig cell marker, in testes. d In situ hybridization of Hspa5. Black broken lines indicate interstitial cells and red broken lines indicate spermatocyte cells. e Localization of cleaved caspase 3. White broken lines indicate interstitial cells and red broken lines indicate spermatocyte cells. Scale bars are 20 μm.

Acknowledgments
This image is the copyrighted work of the attributed author or publisher, and ZFIN has permission only to display this image to its users. Additional permissions should be obtained from the applicable author or publisher of the image. Full text @ Commun Biol