
|
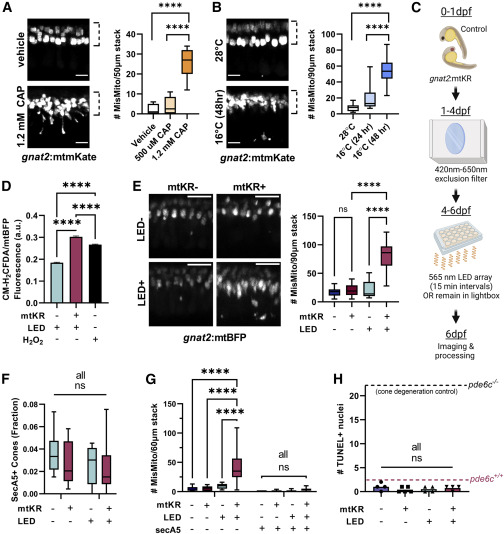
Fig. 1 Stress causes mislocalized mitochondria in cones (A) Chloramphenicol (CAP) causes cone mitochondria (gnat2:mtmKate) to migrate away from the ellipsoid region (dotted line). Mislocalized mitochondria were quantified per fish. n = 11 fish for vehicle and 1.2 mM CAP conditions and n = 8 for 500 μM CAP. ∗∗∗∗p < 0.0001 using one-way ANOVA. Scale bar: 5 μm. (B) Cold (16°C) causes cone mitochondria to migrate from the cone ellipsoid (dotted line). Mislocalized mitochondria were quantified per fish. n = 10 28°C, n = 6 16°C (24 h), and n = 20 16°C (48 h) fish. ∗∗∗∗p < 0.0001 using one-way ANOVA. Scale bar: 5 μm. (C) Schematic for gnat2:mtKillerRed (mtKR) experiments. Embryos were put in a chamber reducing 420–650 nm light to prevent KillerRed activation while maintaining light/dark cycles. At 4 dpf, fish were either kept in the chamber or put on a plate above an LED array of 565 nm light. After 48 h, fish were processed/imaged. (D) CM-H2DCFDA fluorescence in cone mitochondria (gnat2:mtBFP) shows increased mitochondrial ROS upon gnat2:mtKR activation. Fluorescence was normalized to mtBFP to correct for depth in the eye. ∗∗∗∗p < 0.0001 with one-way ANOVA. mtKR−: 26,035 mitochondrial clusters from 8 eyes, mtKR+: 24,144 clusters from 13 eyes, and H2O2: 40,632 clusters from 15 eyes. (E) Only mtKR fish activated by the LED array (mtKR+, LED+, see protocol in C) have increased cone mitochondrial mislocalization. Cone mitochondria labeled with gnat2:mtBFP. Scale bar: 10 μm. n = 13 fish for mtKR−, LED− and mtKR+, LED+; n = 16 for mtKR+, LED−; and n = 14 for mtKR−, LED+. ∗∗∗∗p < 0.0001 with one-way ANOVA. (F) Quantification of secreted Annexin5+ (secA5; apoptotic) cones, identified by the presence of gnat2:mtBFP. Neither LED treatment nor mKR activation is associated with cone cell death. Total cones in a 60 μm stack were estimated by quantification of ellipsoid mitochondrial clusters across n = 5 fish. All comparisons are not significant (ns) with two-way ANOVA. mtKR−, LED−: n = 6; mtKR−, LED+: n = 9; mtKR+, LED−: n = 8; mtKR+, LED+: n = 19. (G) Increases in mislocalized mitochondria (gnat2:mtBFP) upon mtKR activation were only observed in non-apoptotic cells (secA5−). Few mislocalized mitochondria were found in apoptotic cells. Same n as (F). ∗∗∗∗p < 0.0001 with a two-way ANOVA. (H) TUNEL+ nuclei across a 10 μm slice from 6 dpf eyes. No difference detected regardless of LED exposure or the presence of mtKR. Positive control is the pde6c−/− cone degeneration model (black dotted line) and negative control is pde6c+/+ wild-type (WT) sibling (magenta dotted line). n = 4 for all but mtKR+, LED− (n = 5). All comparisons are ns with one-way ANOVA.