
|
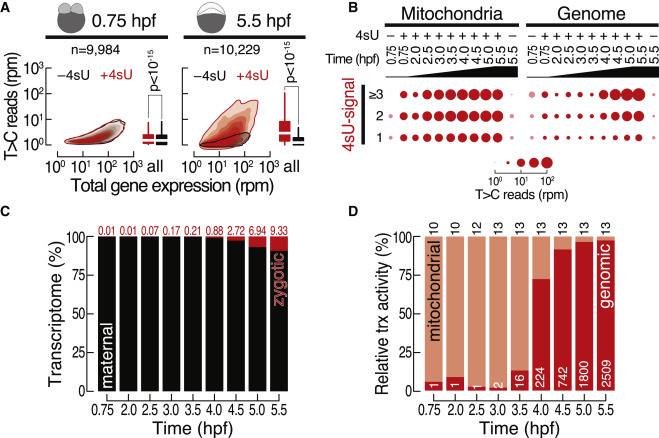
Fig. 2 The transcriptional landscape in zebrafish embryogenesis (A) Comparison of de novo transcription (i.e., T>C reads in rpm) with gene expression (in rpm) in zebrafish embryos injected with 4sU (+4sU, red) or in untreated control embryos (−4sU, black) at the indicated developmental time points (in hpf). Boxplots show a quantitative comparison of de novo transcription signal by comparing T>C reads. p value (Wilcoxon test) is shown. n, number of inspected genes. (B) Balloon plots report number of reads (in rpm) containing one, two, or three and more T>C conversions mapping to the mitochondrial (left) or the nuclear genome (right). (C) Contribution of zygotic (red, percentage indicated on top) and maternal (black) transcripts to gene expression at the respective time points (hpf). (D) Relative transcriptional activity of the mitochondrial (light red) and nuclear genome (dark red). The number of genes for each category is indicated.