
|
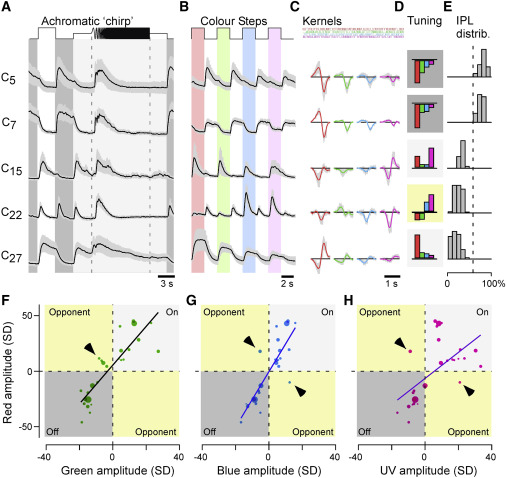
Fig. 2 ACs are kinetically diverse but spectrally simple (A–E) Example cluster means ± SD in response to the white chirp (A) and color-step stimuli (B), spectral kernels (C) corresponding to mean kernel amplitudes (D), and each cluster’s distribution across the IPL (E). Shadings in (D) annotate cluster polarity (dark, Off; light, On; yellow, color opponent). (F–H) Relationship of each clusters’ kernel amplitudes (n = 27 clusters) in red (y axis) plotted against the corresponding amplitudes in green (F), blue (G), and UV (H). Note that most points scatter across the two non-opponent quadrants of the plots, with exceptions highlighted by arrowheads. Dot size indicates the number of ROIs in a cluster. Non-weighted line fits are superimposed for illustration.