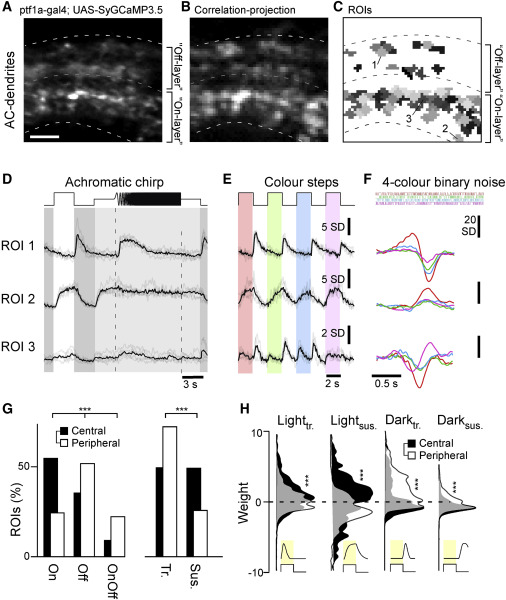
Fig. 1 Recording AC functions in vivo (A–C) Example scan of syGCaMP3.5-expressing AC dendrites within the IPL, showing the scan average (A); a projection of local response correlation, indicating regions of high activity (B); and the correspondingly placed ROI map (C). Scale bar, 5 μm. (D–F) Example regions of interest (ROIs, cf. C), with mean trial averages (black) superimposed on individual repeats (gray) to the three light stimuli tested: an achromatic chirp stimulus (D), four spectrally distinct steps of light from dark (red, green, blue, UV, as indicated; STAR Methods) (E), and a spectral noise stimulus used to establish linear filters (kernels) at the same four wavelengths (F). (G) Distribution of ROIs from the central (black, n = 927 ROIs, 10 scans, 6 fish) and peripheral retina (white, n = 816 ROIs, 10 scans, 6 fish) by polarity (On/Off/On-Off) and kinetics (transient/sustained). Chi-square test, p < 0.001 for both datasets. (H) Distribution of kinetic component weights (STAR Methods; cf. Figure S1B) of central and peripheral ROIs. Wilcoxon rank-sum test, p < 0.001 for all four datasets.
Image
Figure Caption
Acknowledgments
This image is the copyrighted work of the attributed author or publisher, and
ZFIN has permission only to display this image to its users.
Additional permissions should be obtained from the applicable author or publisher of the image.
Full text @ Cell Rep.

