
|
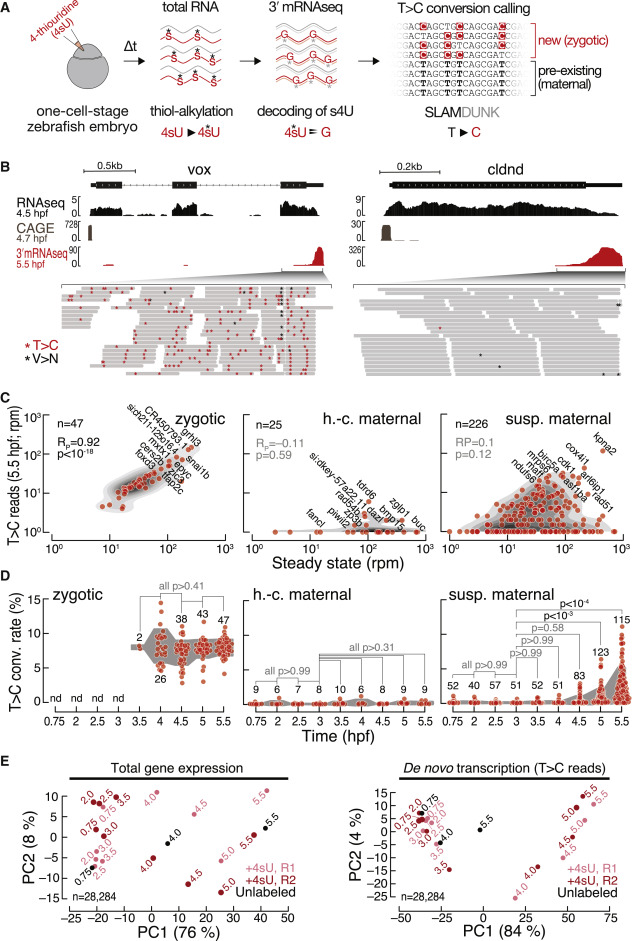
Fig. 1 3′ mRNA SLAMseq in zebrafish embryos distinguishes zygotic from maternally deposited mRNA (A) Zebrafish embryos were injected with 4-thiouridine (4sU; 1.5 mM) at the 1-cell stage and development proceeded for a defined time (Δt), followed by total RNA preparation and SLAMseq employing 3′ mRNA sequencing. Zygotic transcripts were distinguished from maternal mRNAs by the presence of T>C conversions at sites of 4sU incorporation as identified by SLAMDUNK.21 (B) Representative genome browser screenshot of the zygotic gene ventral homeobox (vox; left) and the maternal gene claudin d (cldnd; right). Tracks for poly(A)-selected RNA-seq (top), cap analysis gene expression (CAGE; middle; remapped from Haberle et al.14), and 3′ mRNA SLAMseq (bottom), sampled at the indicated developmental stage (hours post-fertilization [hpf]), are shown. Zoom in shows individual reads of 3′ mRNA SLAMseq datasets mapping to the respective 3′ UTR counting windows. Asterisks indicate T>C conversions (T>C; red) or any other conversions (V>N; black). (C) Comparison of de novo transcription (T>C reads in reads per million [rpm]) and gene expression (in rpm) for pre-defined zygotic (n = 47), high-confidence (h.-c.; n = 25), and suspected (susp.; n = 226) maternal genes at 5.5 hpf. Pearson correlation coefficient (RP) and associated p values (p) are shown. (D) T>C conversion (conv.) rate for transcripts defined in (C) during MZT (time in hpf). Individual genes for which a confident average conversion rate could be derived from two independent biological replicates (red, n = number of genes) and interquartile range (gray area) are shown. p values (Kruskal-Wallis and Dunn’s multiple comparison test) are indicated; nd, not detected. (E) Principal-component analyses of unfiltered control (unlabeled; black) and two independent 3′ mRNA SLAMseq (+4sU; R1 light and R2 dark red) experiments at the indicated developmental time points (in hpf). Gene expression (left); de novo transcription (T>C reads) (right). The variance of each principal component is indicated in a percentage. n, number of genes considered for the analysis.