IMAGE

Figure 4.

ID
ZDB-IMAGE-240108-21
Source
Figures for Mbarek et al., 2023
Image
Figure Caption

Figure 4.

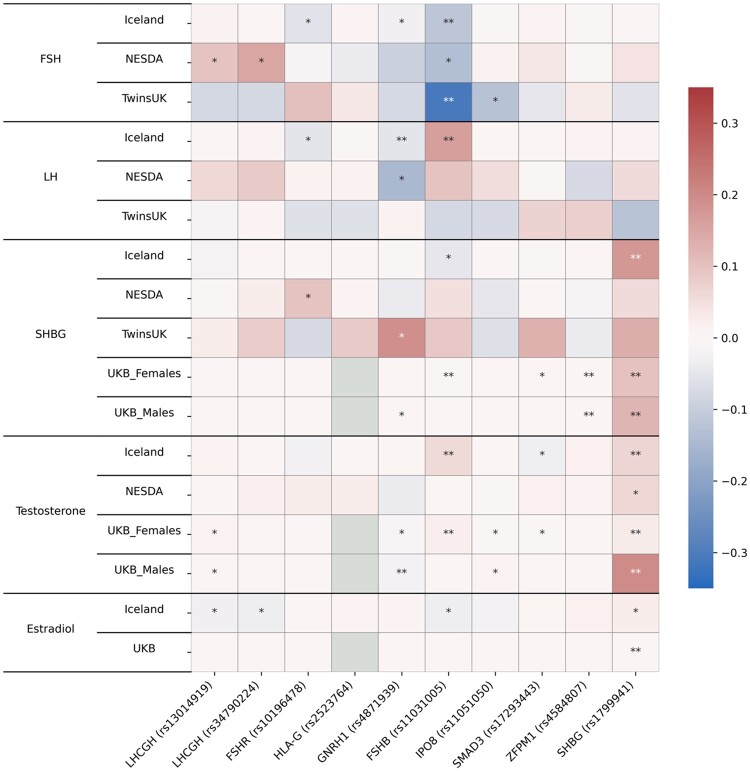
Association of top dizygotic (DZ) twinning single nucleotide polymorphisms (SNPs) with in vivo reproductive hormone data from four independent studies. Heat map showing the beta value of the association of each DZ twinning SNP and corresponding hormone data supplied by the indicated study. SNPs with a positive effect (positive beta) are shown in red, SNPs with a negative effect (negative beta) are shown in blue. Darker shading indicates beta values of larger magnitude. A single asterisk (*) indicates nominal significance at alpha = 0.05, and the double asterisk (**) indicates significance at the alpha corrected for multiple testing, i.e. alpha = 0.05/(10 × 17). Cells in light gray represent missing/unavailable data. Additional details, including study sample sizes and hormone measurement specifications, can be found in Supplementary Table S12. LHCGH, luteinizing hormone/choriogonadotropin hormone; FSHR, follicle stimulating hormone receptor; HLA-G, human leukocyte antigen G; GNRH1, gonadotropin releasing hormone 1; FSHB, follicle stimulating hormone subunit beta; IPO8, importin 8; SMAD3, mothers against decapentaplegic homolog 3; ZFPM1, zinc finger protein; FOG, Family Member 1; SHBG, sex hormone binding globulin; FSH, follicle stimulating hormone; LH, luteinizing hormone; Test, total testosterone; Est, estradiol. Iceland (deCODE), NESDA, TwinsUK and UKB are the four studies.

Acknowledgments
This image is the copyrighted work of the attributed author or publisher, and ZFIN has permission only to display this image to its users. Additional permissions should be obtained from the applicable author or publisher of the image. Full text @ Hum. Reprod.