IMAGE

Figure 2.

ID
ZDB-IMAGE-240108-19
Source
Figures for Mbarek et al., 2023
Image
Figure Caption

Figure 2.

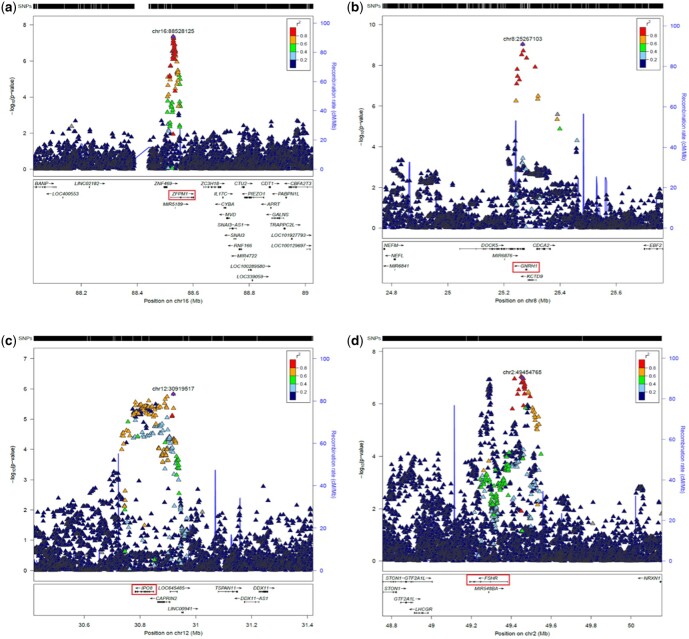
Regional association plots for genome wide association study (GWAS) meta-analysis, for newly-reported associations. Regional association plots for the four new regions reported in Table 2. The reference single nucleotide polymorphism (SNP) is the most highly associated one reported. The suggested gene in the text is highlighted in red. Loci are: (a) 16q24.2; (b) 8p21.2; (c) 12p11.21; (d) 2p16.3. Approximate conditional analysis in GCTA on lead SNPs (not shown) shows only one significant association in each case. Plots were prepared using a stand-alone copy of LocusZoom 1.3 (http://locuszoom.org/) for the 1000G Release 3 European LD reference, and hg19/Build 37.

Acknowledgments
This image is the copyrighted work of the attributed author or publisher, and ZFIN has permission only to display this image to its users. Additional permissions should be obtained from the applicable author or publisher of the image. Full text @ Hum. Reprod.