
Image
|
Figure Caption
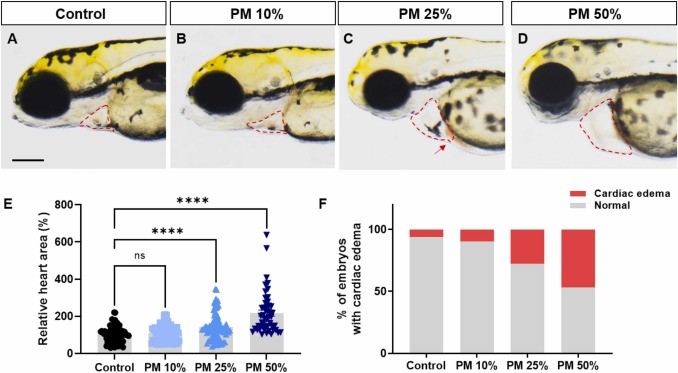
Fig. 2 Cardiac malformation in zebrafish embryos exposed to PM. (A–D) Representative images of the cardiac morphology after PM exposure at 3 days post-fertilization (dpf). Red dotted line indicates the pericardial sac, and red arrow indicates venous congestion. Scale bar, 500 μM. (E) Relative heart area (%) of embryos. Kruskal–Wallis test (n = 80, 71, 86, and 48 per group; ****p < 0.0001; n.s., not significant.) (F) Percentage of embryos with pericardial edema per group.
Acknowledgments
This image is the copyrighted work of the attributed author or publisher, and
ZFIN has permission only to display this image to its users.
Additional permissions should be obtained from the applicable author or publisher of the image.
Full text @ Ecotoxicol. Environ. Saf.