IMAGE

Figure 4

ID
ZDB-IMAGE-231225-63
Source
Figures for Lee et al., 2023
Image
Figure Caption

Figure 4

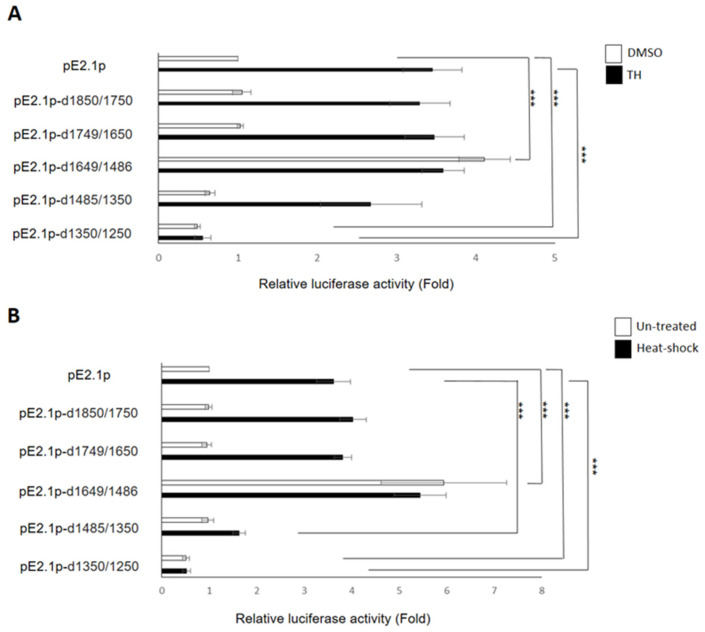
Comparison of the promoter activity of ENDOU-1 driven by different internal deletion clones from −2.1 kb of the ENDOU-1 fragment. (A) In vitro system. Histograms presented the relative luc activity obtained from HEK-293T cells cotransfected either phRG-TK (20 ng/well) combined with pE2.1p or phRG-TK (20 ng/well) combined with different internal deletions (100 ng/well), as indicated on the left side. For example, plasmid pE2.1p-d1850/1750 contained a −2.1 kb fragment of ENDOU-1, but deletion of −1850~−1750 nucleotides. The luc activities obtained from control and five deletion clones, as indicated, were quantified both during normal (DMSO) (represented by empty box) and Thapsigargin (TH)-induced stress condition (represented by solid box). HEK-293T cells treated with DMSO served as control group. (B) In vivo system. Histograms presenting the relative luc activity obtained from zebrafish embryos microinjected at the one cell stage with either indicated plasmids (6.9 pg/embryo) and phRG-TK (2.3 pg/embryo) followed by heat-shock treatment at 72 hpf and luminescence detection at 96 hpf. Microinjected zebrafish embryos not exposed to heat shock served as the control group. The relative luc activity was represented by the fold change in the Flu/Rlu ratio over that obtained from the control group normalized as 1. Values representing control and heat-shock-treated embryos were averaged from three independent experiments. A one-way ANOVA, followed by Tukey’s multiple comparison test, was used to perform statistical analysis (***, p < 0.001; error bars indicate mean ± SD).

Acknowledgments
This image is the copyrighted work of the attributed author or publisher, and ZFIN has permission only to display this image to its users. Additional permissions should be obtained from the applicable author or publisher of the image. Full text @ Int. J. Mol. Sci.