IMAGE

Figure 3

ID
ZDB-IMAGE-231225-62
Source
Figures for Lee et al., 2023
Image
Figure Caption

Figure 3

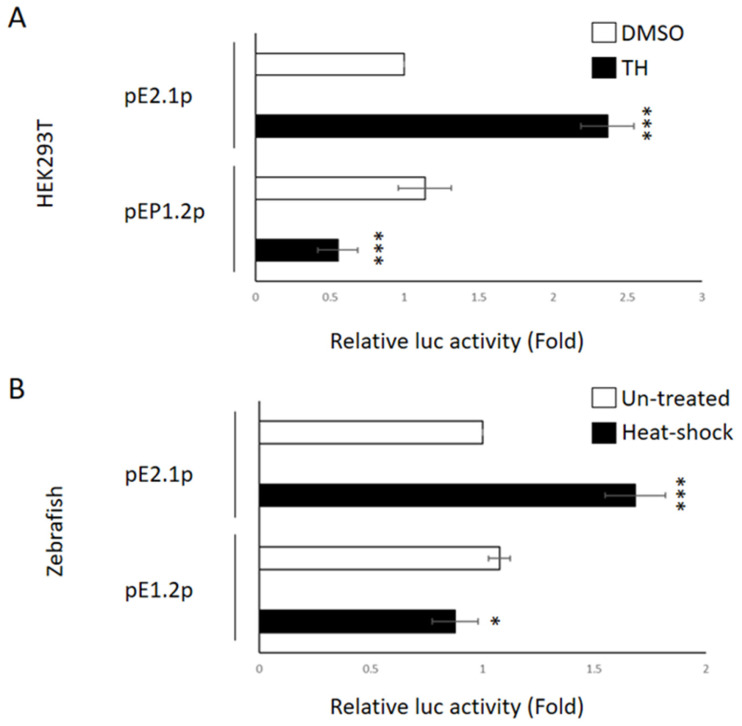
Comparison of luc expression activity driven by the DNA fragments −2055~+77 and −1125~+77 of human ENDOU-1 gene during ER stress. (A) In vitro system. Histograms presenting the relative luc activity obtained from HEK-293T cells cotransfected with either pE2.1p (containing −2055~+77 fragment; 100 ng/well) combined with phRG-TK (20 ng/well) (above) or pE1.2p (containing −1125~+77 fragment; 100 ng/well) combined with phRG-TK (20 ng/well) (bottom) in the absence (empty) or presence (solid) of ER stress inducers. HEK-293T cells treated with DMSO served as the control group. (B) In vivo system. Histograms presenting the relative luc activity obtained from zebrafish embryos microinjected at the one-cell stage with either pE2.1p (containing −2055~+77 fragment; 6.9 pg/embryo) combined with phRG-TK (2.3 pg/embryo) (above) or pE1.2p (containing −1125~+77 fragment; 6.9 pg/embryo) combined with phRG-TK (2.3 pg/embryo) (bottom), followed by no treatment (untreated; empty) or heat shock (solid) at 72 hpf and detection of luc activity at 96 hpf. Microinjected zebrafish embryos not exposed to heat shock served as the untreated control group. Relative luc activity was represented by the fold change of Flu/Rlu ratio over that obtained from the control group normalized as 1. Values representing untreated control and heat-shock-treated embryos were calculated from three independent experiments and presented as mean ± SD (n = 3). Student’s t-test was used to determine significant differences between pE2.1p- and pE1.2p-injected groups (***, p < 0.001; *, p < 0.05).

Acknowledgments
This image is the copyrighted work of the attributed author or publisher, and ZFIN has permission only to display this image to its users. Additional permissions should be obtained from the applicable author or publisher of the image. Full text @ Int. J. Mol. Sci.