
|
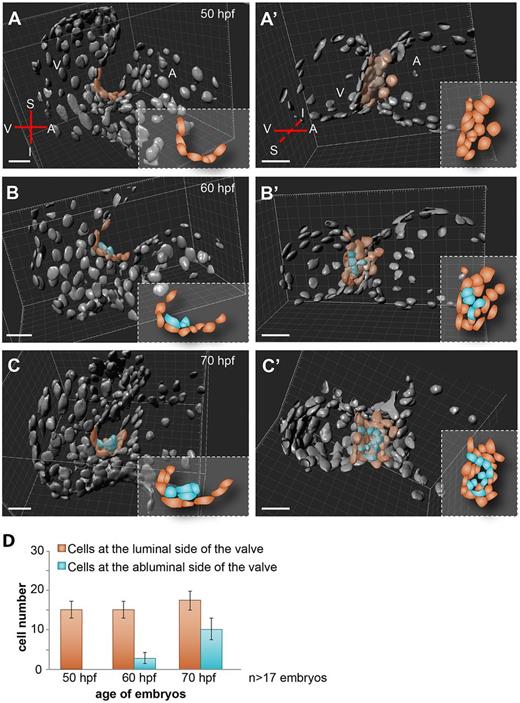
Fig. 2 Complex cell rearrangements form the immature valve leaflets. 3D volume renderings of Tg(kdrl:nls-EGFP) embryonic hearts of three representative examples at 50 (A,A′), 60 (B,B′) and 70 (C,C′) hpf. 3D volume rendered views in sagittal and coronal projections are shown in A-C and A′-C′, respectively. The single-layered AVC endocardium is remodeled into a multilayered structure by an increasing number of endocardial cells located at the abluminal side of the immature valve (false colored in blue). At 60 hpf, 4 (B,B′,D) and at 70 hpf, 10 (C,C′,D) cells are detected at the abluminal side of the valve. Quantification of the mean (±s.d.) number of cells at the luminal and abluminal sides of the forming valve is shown in D. At 50 hpf, cells at the superior AVC were counted in 19 embryos, at 60 hpf in 17 embryos and at 70 hpf in 20 embryos. Blue cells represent those located at the abluminal side and reddish brown cells represent those at the luminal side of the forming valve. Cartoons depict cell arrangements observed at the superior AVC. A, atrium; I, inferior AVC; S, superior AVC; V, ventricle. Scale bars: 20 µm.