
Image
|
Figure Caption
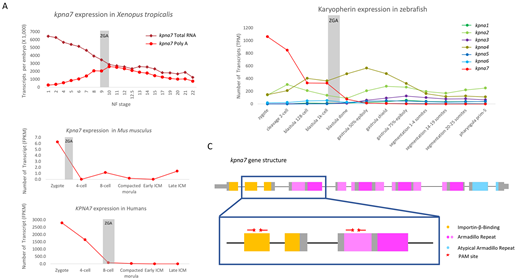
Fig. 3 Gene structure and expression of kpna7 during development. (A) Expression levels of kpna7 in other species display a similar pattern of the maternal expression of kpna7 homologs. (B) Expression levels of the Kpna gene family throughout zebrafish development, from zygote to Prim-5 (24 hpf) stage. The maternal-specific transcript, kpna7, is represented in red and the gray bar marks the zygotic genome activation. (C) Diagram of the gene structure of kpna7, showing the known motifs and target sites of guide RNAs (red lines) and PAM sites (red stars).
Acknowledgments
This image is the copyrighted work of the attributed author or publisher, and
ZFIN has permission only to display this image to its users.
Additional permissions should be obtained from the applicable author or publisher of the image.
Full text @ Development