
|
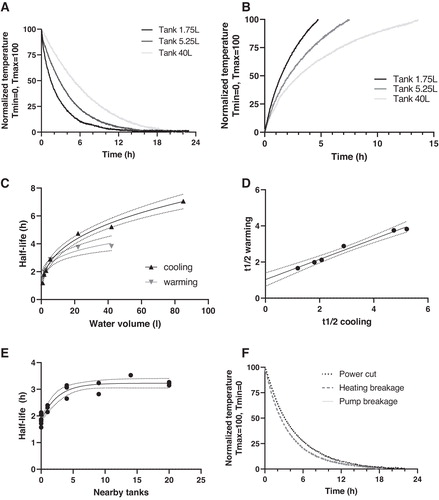
Fig. 2 Measurements and model fitting of temperature changes in zebrafish tanks. (A) Examples of measurements of water cooling down rates in different size tanks. Temperatures were measured at 1-minute intervals. Normalized temperatures were plotted, where 0 is minimum temperature and 100 is maximum temperature. (B) Examples of measurements of water warming up rates in different size tanks. Normalized temperatures were plotted, where 0 is minimum temperature and 100 is maximum temperature. (C) Nonlinear regression of half-life (in hours) and water volume in tanks (in liters). (D) Linear regression of warming half-lives (t1/2) and cooling half-lives (t1/2). (E) Half-life measurements for water cooling in housing rack with different tank occupancies. Nearby tanks were measured as tanks in the row, and row below and row above of the tank with the temperature logger. (F) Temperature measurements during power outage, heating breakage, and pump breakage tests. n = 3/group, mean values are plotted and normalized temperatures are shown.