
Image
|
Figure Caption
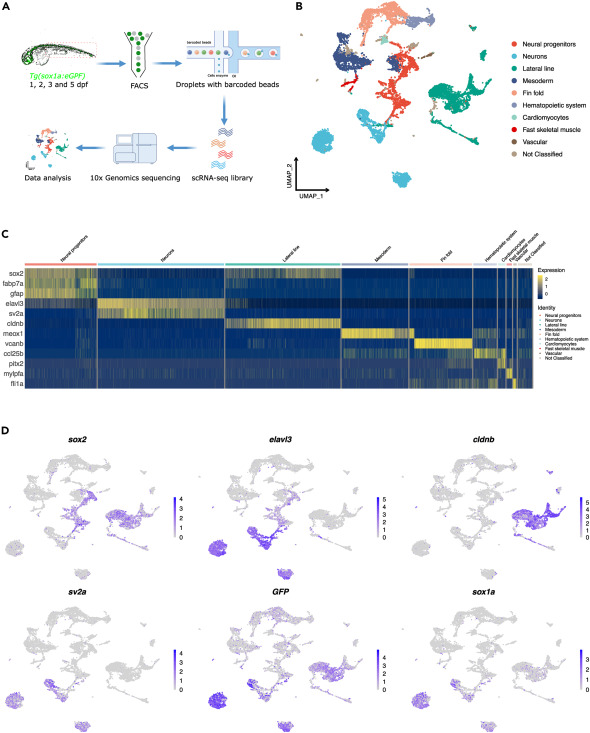
Fig. 1 Integration of all single-cell datasets and annotation of main cell types (A) Schematic workflow of scRNA-seq (part of it was created with BioRender.com). (B) UMAP shows the main cell types annotated based on the top marker and known marker genes. (C) A heatmap showing the representative marker genes expressed in main cell types. (D) Feature Plots showing marker genes used to sort in-silico neural progenitor and neuronal cell populations. Note: cldnb is used to exclude lateral line cells, which are gfp+.
Acknowledgments
This image is the copyrighted work of the attributed author or publisher, and
ZFIN has permission only to display this image to its users.
Additional permissions should be obtained from the applicable author or publisher of the image.
Full text @ iScience