
|
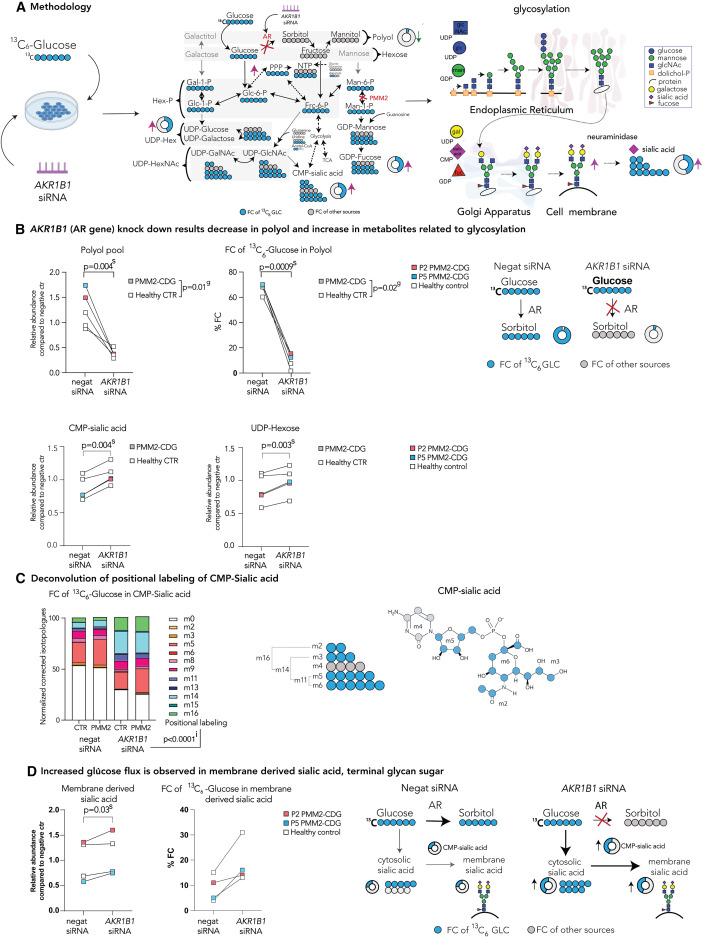
Fig. 4 Tracer studies with 13C6 glucose upon AKR1B1 siRNA inhibition reveal metabolic rewiring and increased de novo sugar nucleotide synthesis (A) Methodology. To assess the changes in glucose flux in AKR1B1 KD cells, cells were incubated with either siRNA targeting the AR gene AKR1B1 or non-targeting (negative) siRNA for 48 h. Then, medium was changed and the medium containing either 13C6-glucose (tracer glucose) or 12C6-glucose was added. Tracer was then metabolized throughout subsequent biochemical pathways. Metabolites were extracted for metabolomics analysis. Furthermore, membrane-bound sialic acid, the end sugar of glycan chains, was isolated and subjected to metabolomics analysis. (B) AKR1B1 KD results in a decrease in polyols and increase in metabolites related to glycosylation. Relative polyol abundances and FC of 13C6 glucose in polyol were decreased following AR KD, while UDP-hexose and CMP-sialic acid abundances were increased. (C) Deconvolution of positional labeling of 13C6 glucose in CMP-sialic acid. Increase in m11, m14, and m16 after AR inhibition and incubation with 13C6 glucose in CMP-sialic acid indicates multiple pathways (PPP, nucleotide biosynthesis, glucosamine biosynthesis, and glycolysis) are simultaneously upregulated upon AR inhibition. (D) Increased glucose flux is observed in membrane-derived sialic acid, terminal glycan sugar. Increase in abundance and FC of 13C6-glucose in cytosolic sialic acid is observed in cells treated with siRNA targeting AKR1B1 (see Figure S4B). These changes ultimately lead to increase in abundance and FC of 13C6-glucose in CMP-sialic acid and sialic acid derived from membranes, suggesting that sialylation and overall glycosylation are improved upon AR inhibition. Relative metabolite abundances were calculated based on the average of CTR treated with non-targeting (negative) siRNA. FC of 13C6 glucose was calculated for each metabolite based on the isotopologue distribution and corrected for naturally occurring 13C isotopes (see STAR Methods). Two-way repeated-measures ANOVA or mixed-effect analysis with repeated-measures analysis were performed. For the additional metabolites, see Figure S4B. Specific relative metabolite abundances in PMM2-CDG and CTR and %FC can be found in Figure S4B. The number of biological (n) and technical (t) replicates: PMM2-CDG n = 2, t = 3; healthy control n = 3, t = 1–3 (B and C); PMM2-CDG n = 2, t = 2; healthy control n = 2, t = 2 (D). The artworks are a visual representation of the results, where the size of the pies represents the arbitrary abundance of represented metabolites across both CTR and PMM2-CDG, while the color of the pie represents the average %FC of 13C6-glucose in the specific metabolite. FC, fractional contribution; negat siRNA, negative/non-targeting siRNA; AKR1B1 siRNA, siRNA targeting ARK1B1 gene; CTR, control; P, patient; g, p value reflecting effect of genotype; s, p value reflecting the effect of the siRNA targeting AKR1B1; i, p value reflecting the interaction between AKR1B1 KD and positional labeling.