
|
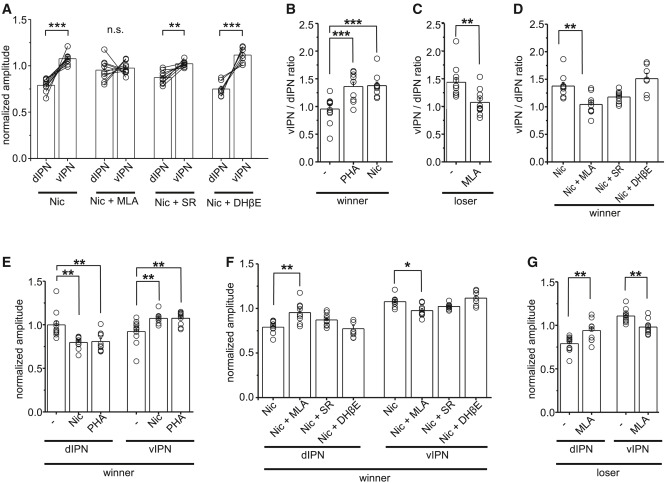
Fig. 3 The agonist and antagonist of α7 nAChR switch dominance in the dHbM-v/iIPN transmission (A) Comparison of normalized peak responses detected in the dIPN and vIPN in a winner treated with Nic (5 μM; n = 10 slices from 10 animals), Nic + MLA (n = 9 slices from 9 animals, p = 0.722, paired t test), Nic + SR (20 μM; n = 9 slices from 9 animals), and Nic + DHβE (10 μM; n = 7 slices from 7 animals). (B–D) Comparison of the vIPN/dIPN ratio calculated from the samples shown in Figures 2F and 2G and (A). (E) Comparison of normalized peak responses in the dIPN and vIPN among α7 nAChR agonist-treated and untreated winner groups using the same datasets as shown in Figure 2K and (A). (F) Comparison of normalized peak responses in the dIPN and vIPN among nicotine and nAChR antagonists treated winner groups using the same datasets as shown in (A). (G) Comparison of normalized peak responses in the dIPN and vIPN between α7 nAChR antagonist treated and untreated loser groups using the same datasets as shown in Figure 2N. Values are presented as mean ± SEM. Statistical significance was defined as ∗∗p < 0.01; ∗∗∗p < 0.001; NS, not significant, p ≥ 0.05.