
|
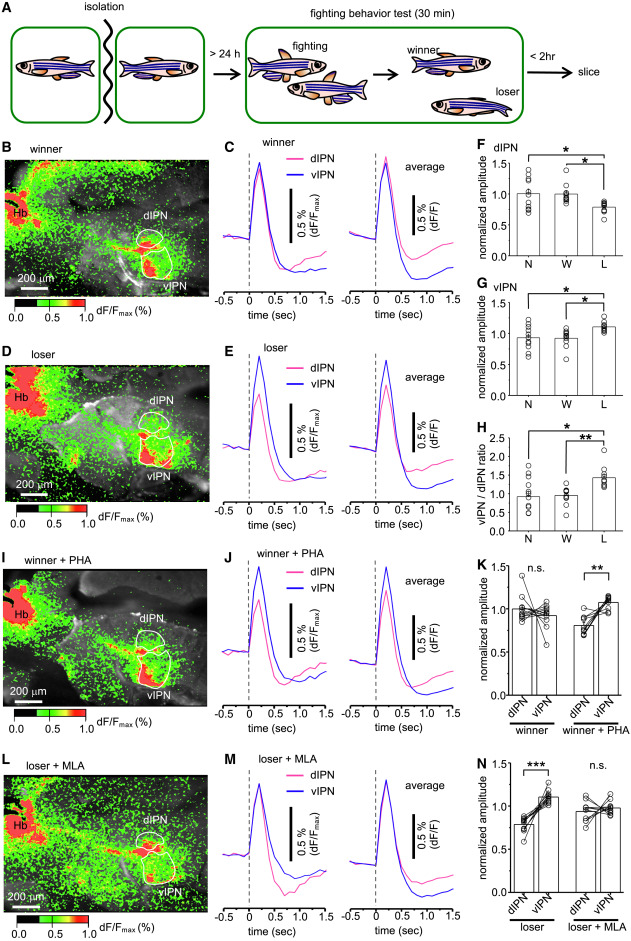
Fig. 2 Pharmacological manipulations of α7 nAChR switch dominance in the dHbM-v/iIPN transmission (A) Schematic time course of experiments. (B, D, I, and L) Representative example of peak intracellular Ca2+ responses in a slice from the winner (B), loser (D), α7 nAChR agonist (1 μM PHA) treated winner (I), and antagonist (50 nM MLA) treated loser (L). Scale bars, 200 μm. (C, E, J, and M) The time course of the intracellular Ca2+ responses detected in the dIPN (pink) and the vIPN (blue) in winner (C), loser (E), winner treated with PHA (J), and loser treated with MLA (M). The representative example detected in a slice (left) and the average of responses in the group (right) are shown. Scale bars, 0.5% dF/F. (F and G) Comparison of normalized peak responses in the dIPN (F) and vIPN (G) among the naive (N, n = 11 slices from 11 animals), winner (W, n = 11 slices from 11 animals), and loser (L, n = 11 slices, from 11 animals). (H) Comparison of the vIPN/dIPN ratio calculated from the same samples with (F) and (G). (K) Comparison of normalized peak responses detected in the dIPN and vIPN in a winner (the same dataset as shown in F and G), and the cases with PHA treatment (n = 10 slices from 10 animals). (N) Comparison of normalized peak responses detected in the dIPN and vIPN in a loser (the same dataset as shown in F and G), and the cases with MLA treatment (n = 11 slices from 11 animals). Values are presented as mean ± SEM. Statistical significance was defined as ∗p < 0.05; ∗∗p < 0.01; ∗∗∗p < 0.001; NS, not significant, p ≥ 0.05.