IMAGE

Fig. 4.

ID
ZDB-IMAGE-231101-13
Source
Figures for Miyadai et al., 2023
Image
Figure Caption

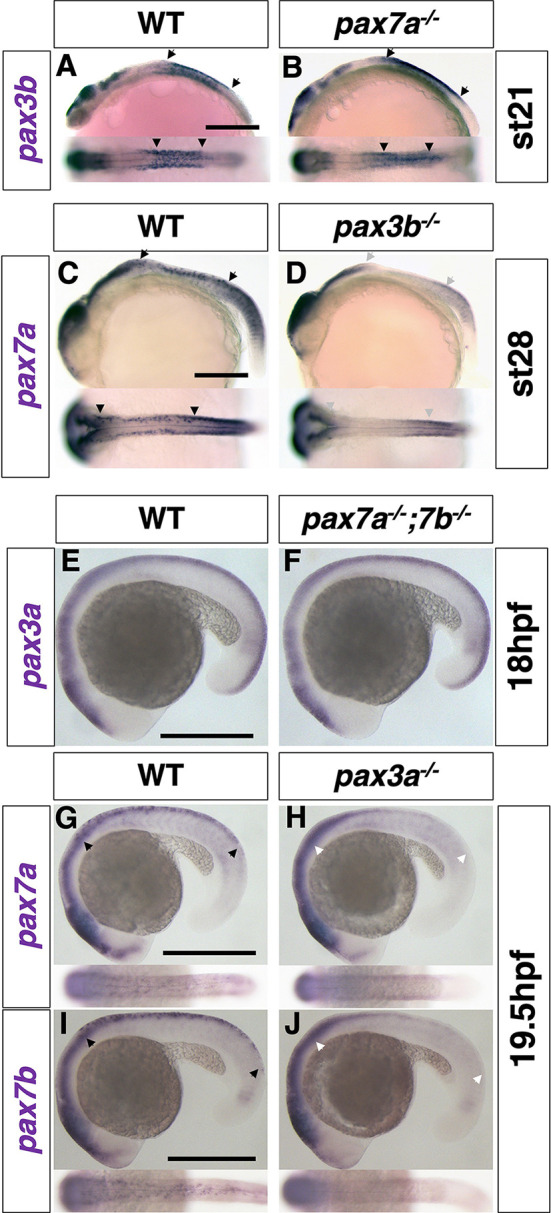
Fig. 4.

pax3 functions upstream of pax7. (A-D) Medaka. (A,B) pax3b expression at stage 21 (6 somite). (C,D) pax7a expression at stage 28 (30 somite). (E-J) Zebrafish. (E,F) pax3a expression at 18 hpf (18 somite). (G,H) pax7a expression at 19.5 hpf (21 somite). (I,J) pax7b expression at 19.5 hpf (21 somite). In medaka, pax3b expression was similar in WT and pax7a mutant embryos (A,B), whereas pax7a expression was largely reduced in NCCs in pax3b mutant embryos compared with WT (C,D). Similarly, in zebrafish, pax3a expression was not altered in pax7a; pax7b double-mutant embryos (E,F), but pax7a and pax7b expression was largely reduced in NCCs in pax3a mutant embryos compared with WT (G-J). Lateral views at top and dorsal views at bottom. Arrowheads indicate the anterior and posterior ends of the expression in the neural crest. Grey and white arrowheads indicate the absence of expression. Images are representative of more than ten embryos. Scale bars: 250 µm.

Acknowledgments
This image is the copyrighted work of the attributed author or publisher, and ZFIN has permission only to display this image to its users. Additional permissions should be obtained from the applicable author or publisher of the image. Full text @ Development