
|
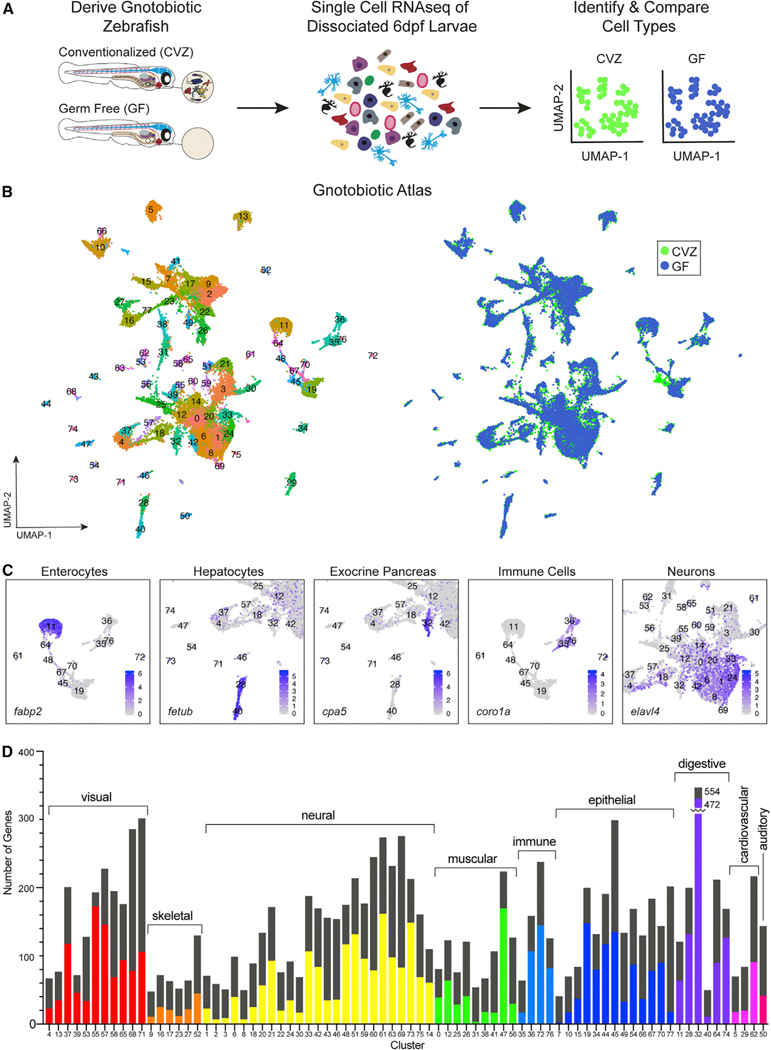
Figure 1. Single-cell transcriptional analysis of whole gnotobiotic larval zebrafish
(A) Whole conventionalized (CVZ) and germ-free (GF) 6 dpf zebrafish larvae were dissociated into individual cells prior to single-cell RNA sequencing.
(B) Uniform manifold approximation and projection (uMAP) plots display 78 cell type clusters shared between experimental groups.
(C) Cell types were identified by their transcriptomic profile; examples (with marker genes) include enterocytes (
(D) Host cell types differentially respond to the presence of the microbiota throughout the body as illustrated by the total number of genes significantly enriched within each experimental group (p < 0.05). The height of the bars represents the total sum of differentially expressed genes in CVZ versus GF cells for each cluster.
The colored portion of each bar represents the number of genes significantly expressed within CVZ cells and the remaining black portion of the bars represents the number of genes significantly expressed in GF cells (minus the colored portion).