
IMAGE
Figure 7.
- ID
- ZDB-IMAGE-231024-8
- Publication
- Zhu et al., 2023 - SAMPL is a high-throughput solution to study unconstrained vertical behavior in small animals
- All Figures
- Figures for Zhu et al., 2023
Image
|
Figure Caption
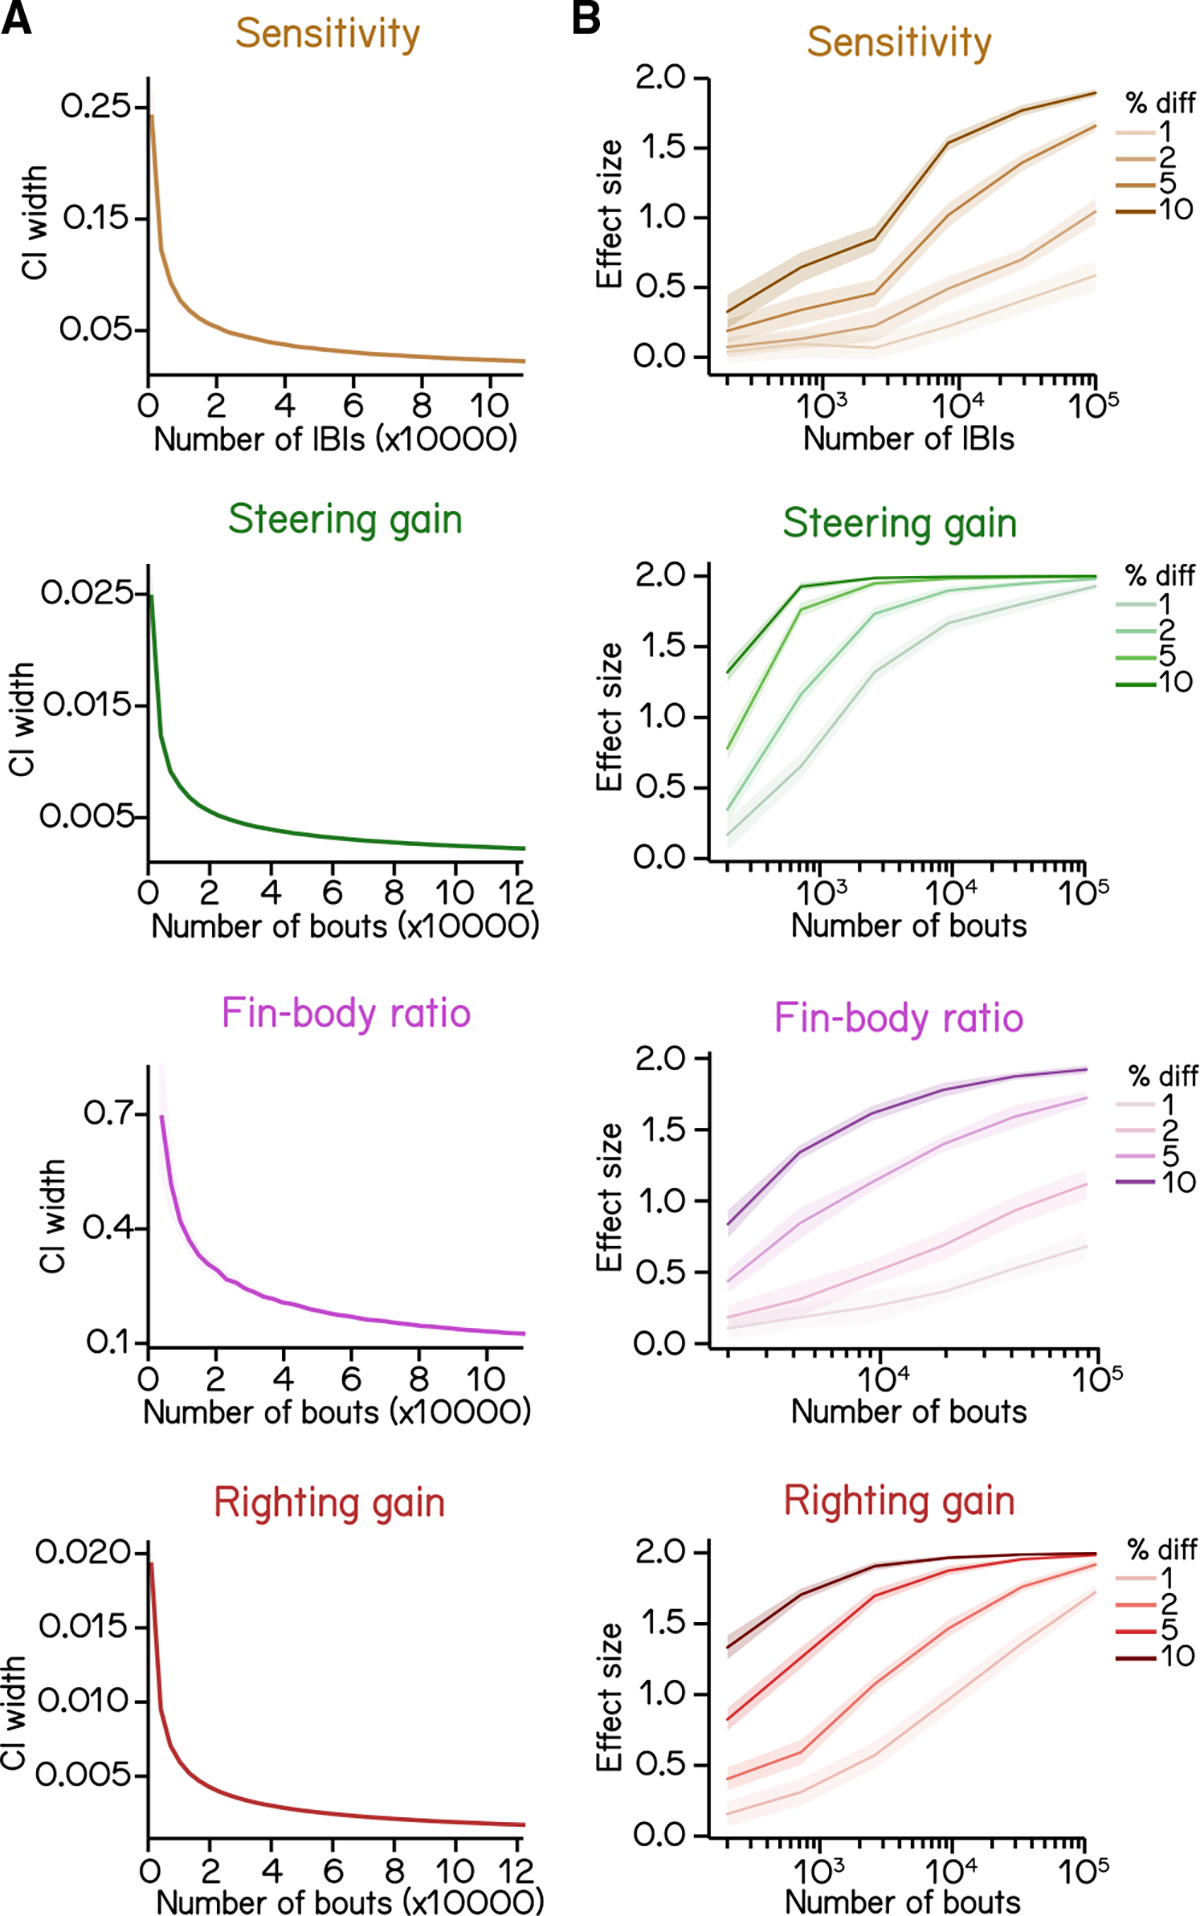
Figure 7. Statistics of regression analysis for swim kinematics
(A) Confidence interval (CI) width of kinematic parameters plotted as a function of sample size at 0.95 significance level (mean ± SD as ribbon). Errors were estimated by resampling with replacement from the complete dataset.
(B) Effect size plotted as a function of sample size at various percentage differences. Mean ± SD.
Refer to
Acknowledgments
This image is the copyrighted work of the attributed author or publisher, and
ZFIN has permission only to display this image to its users.
Additional permissions should be obtained from the applicable author or publisher of the image.
Full text @ Cell Rep.