
Figure 5.
- ID
- ZDB-IMAGE-231024-6
- Publication
- Zhu et al., 2023 - SAMPL is a high-throughput solution to study unconstrained vertical behavior in small animals
- All Figures
- Figures for Zhu et al., 2023
|
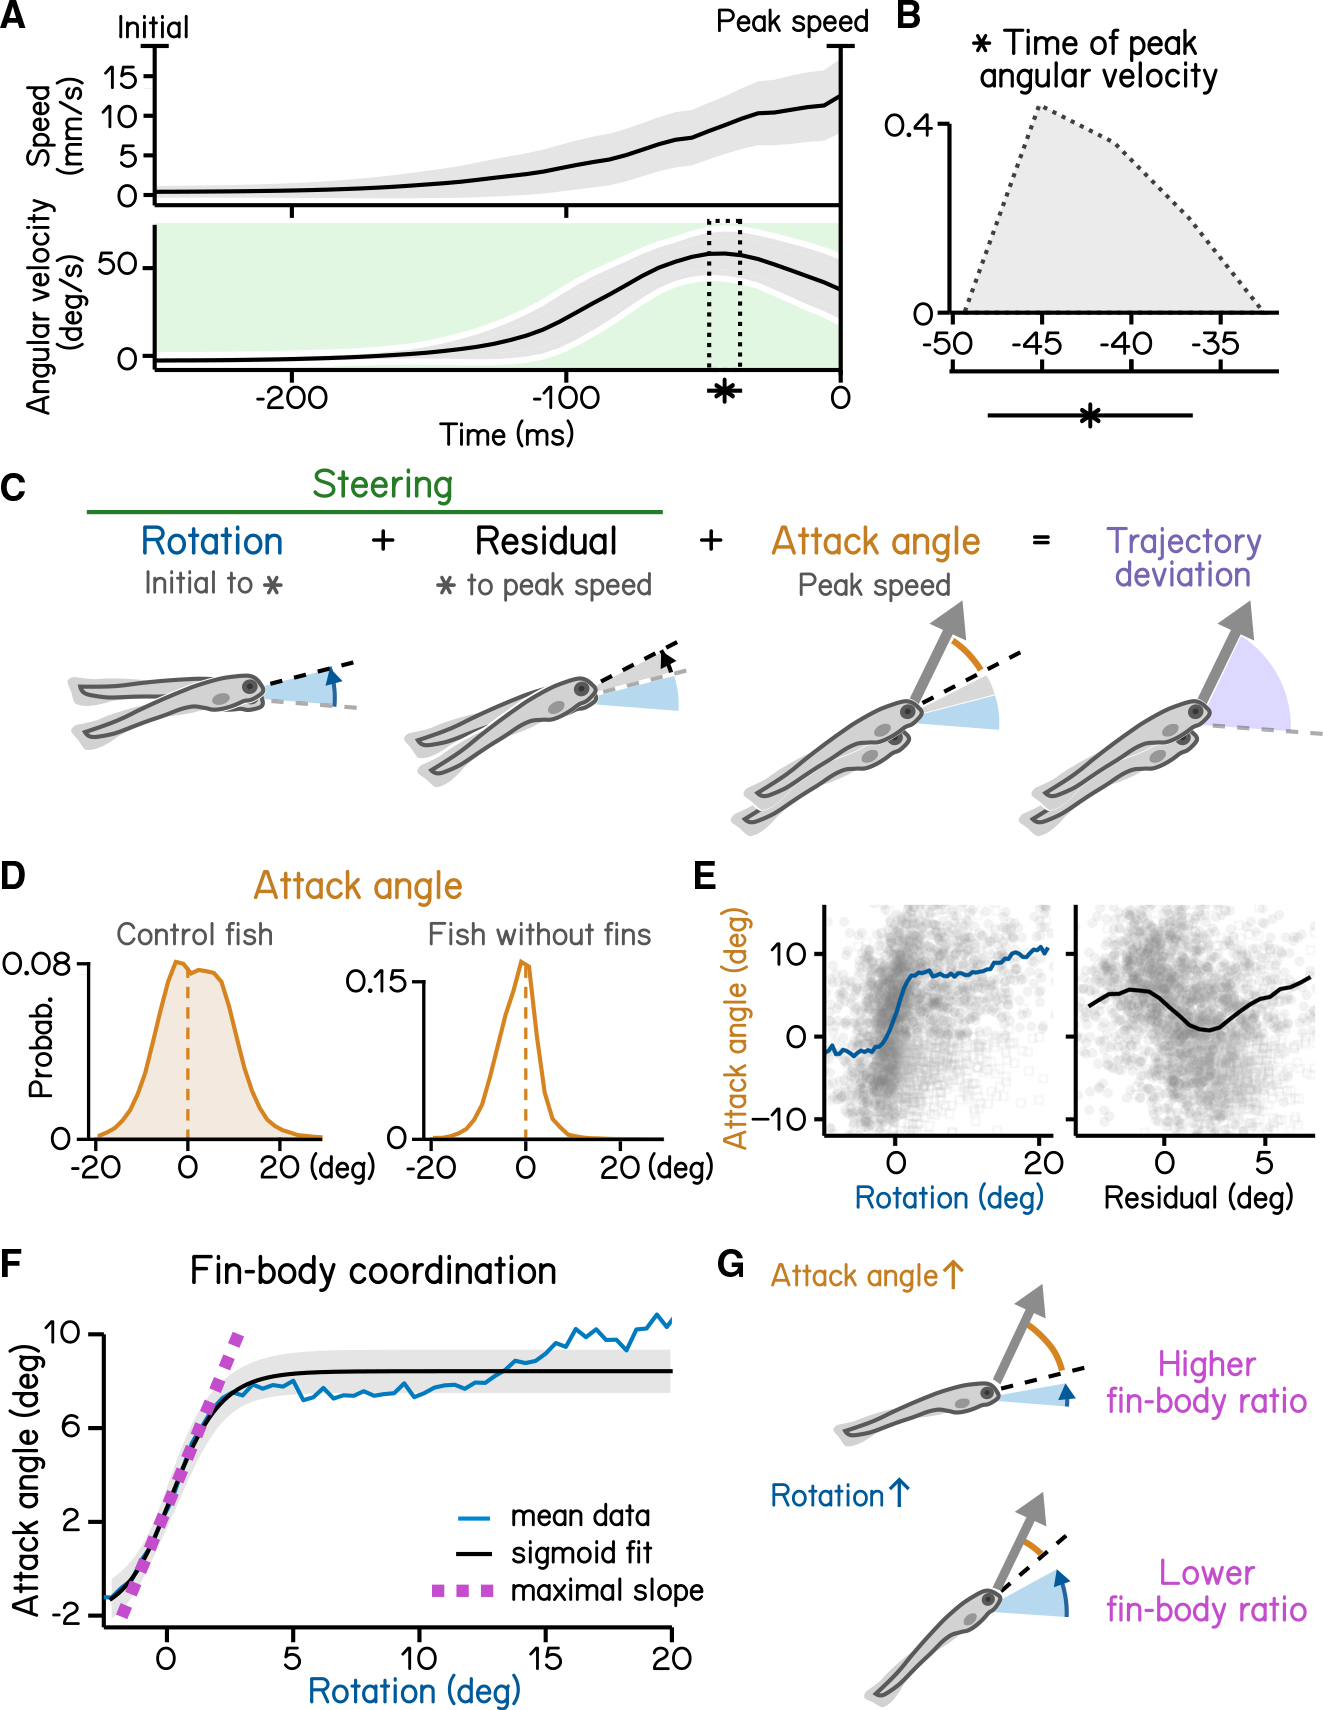
Figure 5. Steering requires coordination of fin and body
(A) Swim speed (top) and angular velocity (bottom) plotted as a function of time. Angular velocity peaks (asterisk and dotted area, mean ± SD) during steering phase (green) before time of the peak speed. Angular velocity is adjusted by flipping signs of bouts with nose-down rotations during steering (mean ± SD across experimental repeats). Shaded region in the top panel indicates mean ± SD across all quantified swim bouts.
(B) Histogram of time of peak angular velocity, binned by frame, across experimental repeats with mean ± SD plotted below.
(C) Illustration of components that contribute to trajectory deviation. Larvae rotate their bodies starting from bout initial (blue) and reach peak angular velocity (asterisk) before peak speed. Any rotation generated during decrease of angular velocity is considered residual (gray). At time of peak speed, there is an offset between the pitch angle (dashed line) and bout trajectory (arrow), which is termed the attack angle (orange). Body rotations, residual, and attack angle add up to trajectory deviation.
(D) Distribution of attack angles in control fish(left) and fish after fin amputation (right). Dashed lines indicate 0 attack angle.
(E) Attack angles plotted as a function of body rotations (left, blue) or residual rotations (right). Rotations and residuals are sorted into 0.5°-wide bins for calculation of binned average attack angles. Swim bouts with negative attack angles while having steering rotations greater the 50th percentile (hollow squares) were excluded for binned-average calculation.
(F) Attack angles plotted as a function of body rotations (blue line) and fitted with a logistic model (black line, R2 = 0.31, mean ± SD). Fin-body ratio is determined by the slope of the maximal slope of the fitted sigmoid (magenta). Rotations are sorted into 0.8°-wide bins for calculation of binned average rotations and attack angles (blue line). Swim bouts with negative attack angles while having steering rotations greater the 50th percentile were excluded for sigmoid modeling.
(G) Schematic illustration of how fin-body ratio reflect climbing mechanics.
For all panels, n = 121,979 bouts from 537 fish over 27 repeats.
See also