
Figure 3.
- ID
- ZDB-IMAGE-231024-4
- Publication
- Zhu et al., 2023 - SAMPL is a high-throughput solution to study unconstrained vertical behavior in small animals
- All Figures
- Figures for Zhu et al., 2023
|
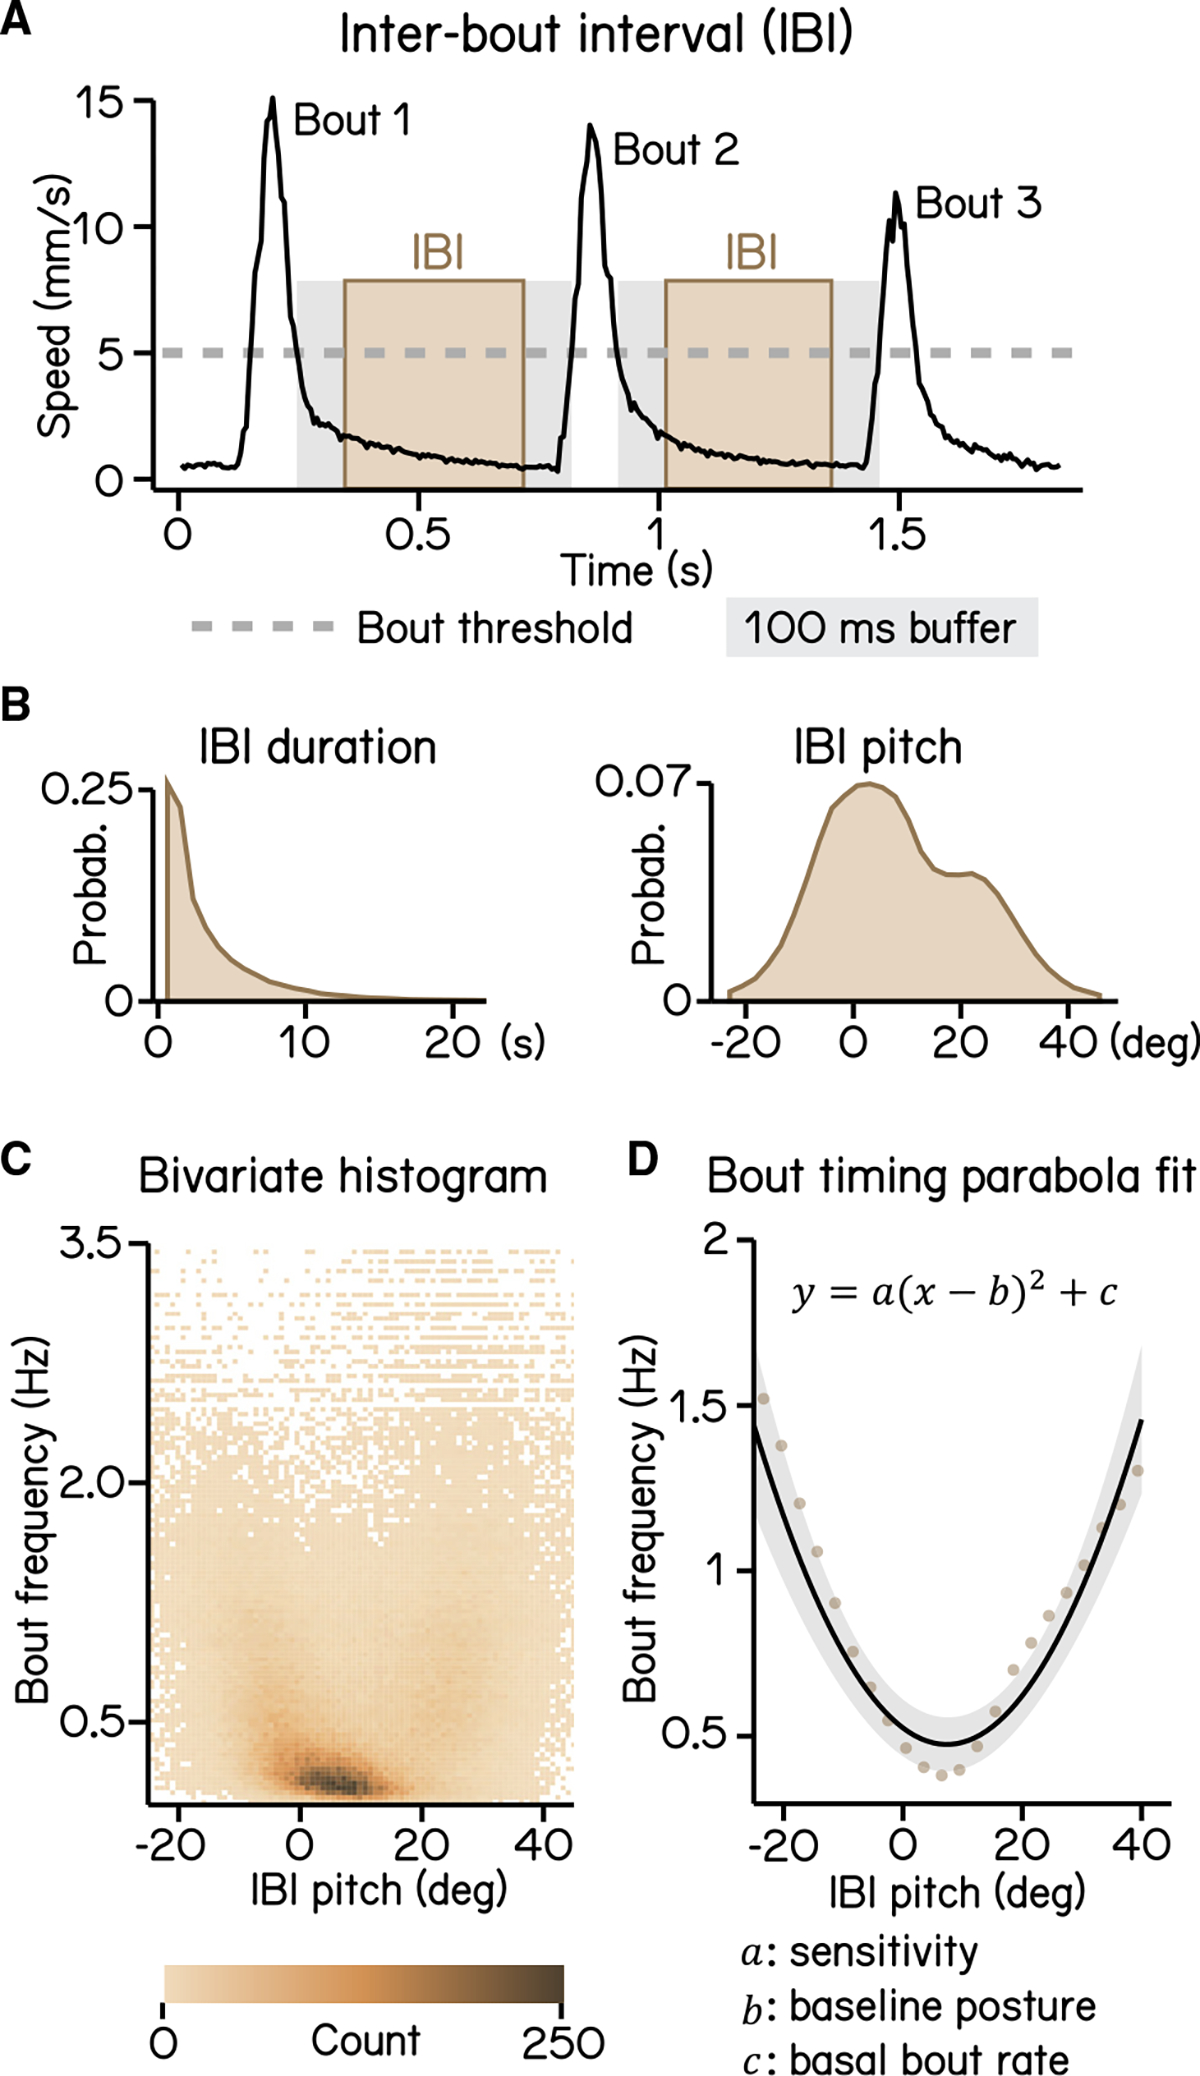
Figure 3. Modeling timing of swim bouts reveals larval sensitivity to pitch changes
(A) An inter-bout interval (IBI; brown area) is defined as the duration when swim speed is below the 5 mm/s homeostasis threshold (dashed line) between two consecutive bouts with a 100 ms buffer window (gray area) deducted from each end.
(B) Distribution of IBI duration (left) and mean pitch angle during IBI (right).
(C) Bivariate histogram of bout frequency and IBI pitch. Bout frequency is the reciprocal of IBI duration.
(D) Bout frequency plotted as a function of IBI pitch and modeled with a parabola (black line, R 2 = 0.14, mean ± SD). Brown dots indicate binned average of IBI pitch and bout frequencies calculated by sorting IBI pitch into 3°-wide bins.
For all panels, n = 109,593 IBIs from 537 fish over 27 repeats.
See also