
|
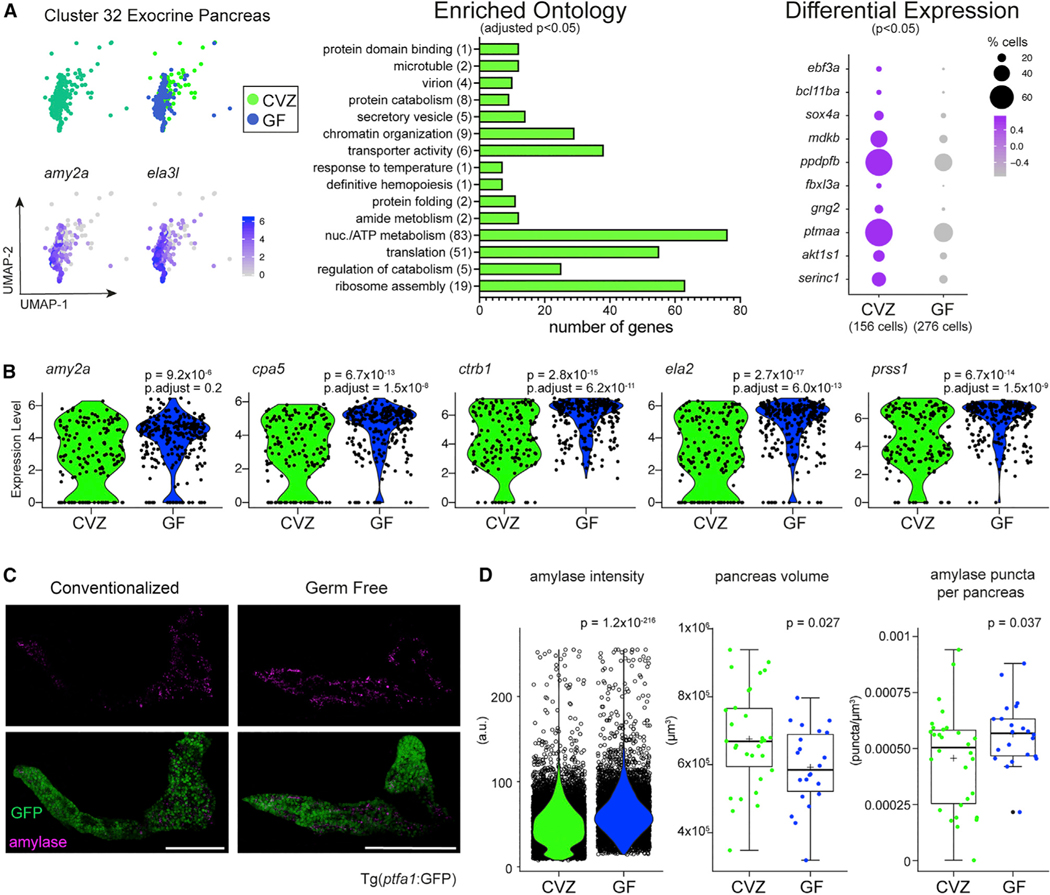
Figure 7. The microbiota promotes tissue development and function within the exocrine pancreas
(A) Cluster 32 is composed of acinar cells from the exocrine pancreas showing high expression of digestive enzymes
(B) Violin plots illustrate the difference in distribution of pancreatic digestive enzyme gene expression between CVZ and GF cells from cluster 32.
(C) Images display amylase protein expression within the exocrine pancreas of CVZ and GF larvae. Images are z projections taken by tile-scan with a confocal microscope. For the green channel, intensity levels were increased to illuminate the whole pancreas evenly for publication but had no impact of data generated from the raw images. Scale bar of 100 μm corresponds to the micrographs.
(D) The violin plot illustrates the average optical intensity of individual amylase granules and the two box plots show the total volume occupied by the pancreas, and the number of amylase puncta per pancreas between CVZ- and GF-derived 6 dpf larvae. All images were taken with the same optical settings and larvae from each experimental group were imaged on the same day in the same session. Each clear dot in the violin plot represents an amylase+ puncta. Each dot in the subsequent two boxplots for pancreas volume and amylase puncta/pancreas represent individual larvae. p values displayed on plots are from Student’s t tests.