
|
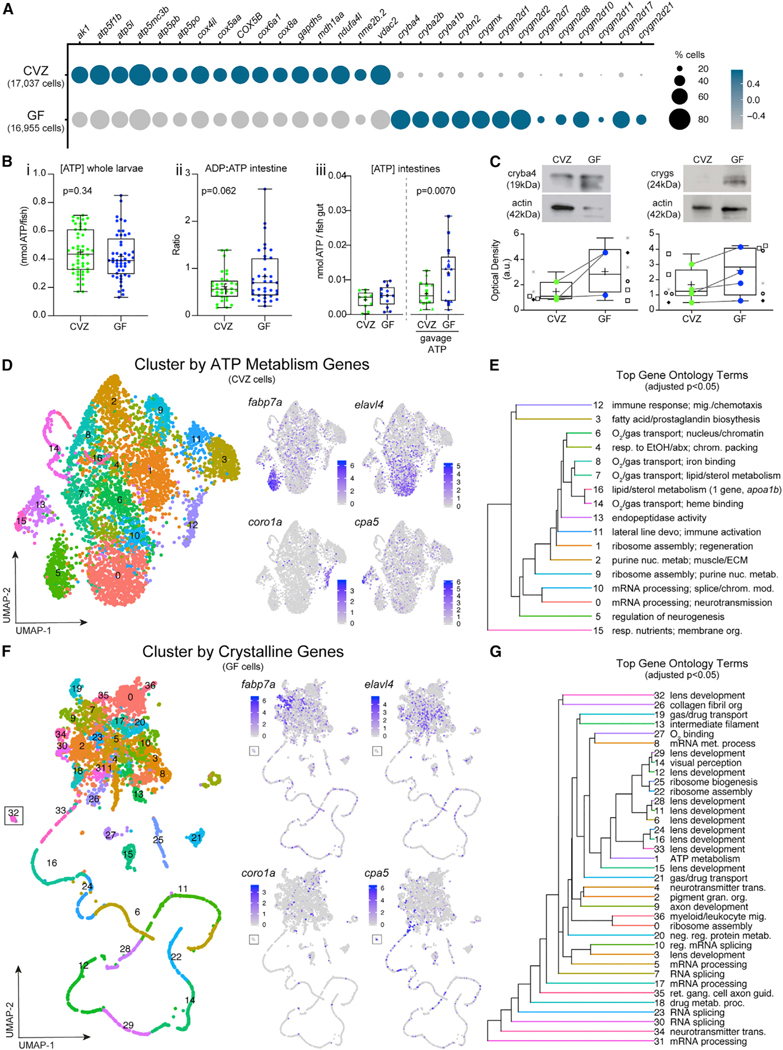
Figure 6. The microbiota induces global patterns of host gene expression
(A) Dot plot illustrates global trends of gene expression across all CVZ and GF cells from whole larvae.
(B) Boxplots show (i) the concentration of ATP from whole larvae, (ii) the ratio of ADP to ATP of dissected larval intestines, and (iii) the concentration of ATP in dissected CVZ and GF larval intestines alone or 20–40 min following gavage with 1 or 10 mM ATP. Each dot in the measurement of ADP/ATP ratio represents the average to two intestines.
(C) Boxplots show the average relative optical density of beta and gamma crystallin protein expression in CVZ and GF larvae. Each symbol represents an individual flask of larvae processed together and matching symbols denote that flasks were from the same gnotobiotic derivation. Colored dots represent average expression between flasks in the same derivation with a line connecting the corresponding derivations between experimental groups.
(D) uMAP plots represent CVZ cell clustering on the basis of expression of genes involved in ATP metabolism. Feature plots illustrate cell types maintaining their original cell type identity.
(E) Hierarchal tree demonstrates the proximity of uMAP plot cells clustered by expression of ATP metabolism genes and the top GO terms on the basis of enriched genes within a given cluster.
(F) uMAP plots represent corresponding GF cells from the original clusters used in (D) clustering on the basis of expression of crystallin genes. Feature plots show that clusters lose their original cell type identity.
(G) Hierarchal tree demonstrates proximity of clusters from the uMAP plot of cells clustered by expression of