IMAGE

Figure 5

ID
ZDB-IMAGE-231016-22
Source
Figures for Shrestha et al., 2023
Image
Figure Caption

Figure 5

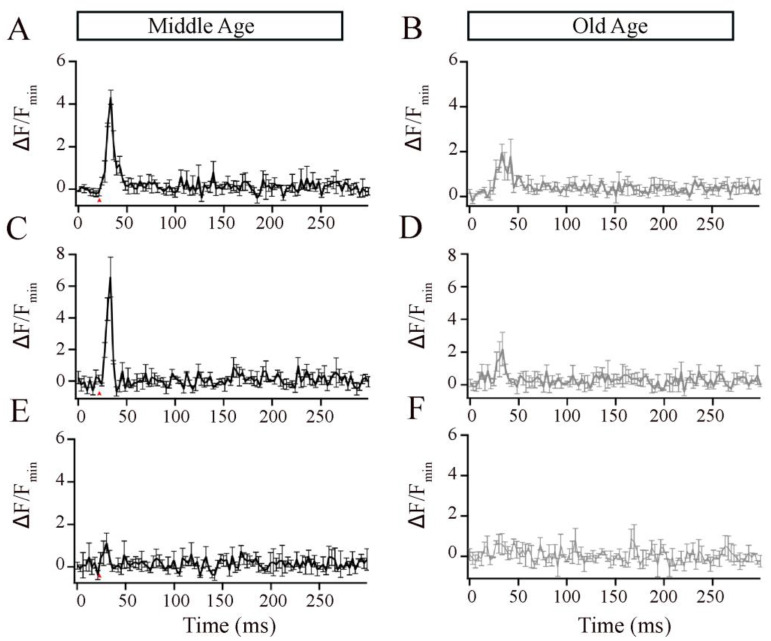
The local Ca2+ responses elicited by brief depolarization at an Mb1 bipolar cell synaptic ribbon were altered in older-aged zebrafish. (A,B) Average Cal520-2LA fluorescence at ribbon locations in response to 10 ms depolarization in Mb1 bipolar cells isolated from middle-aged (MA; left panels; n = 3 ribbons from 3 cells and fish) and older-aged (OA; right panels; n = 3 ribbons from 3 cells and fish) zebrafish with pipette solution containing 2 mM EGTA. Shown is the change in fluorescence (ΔF) from baseline before stimulation, divided by the baseline fluorescence (Fmin). (C,D) Same as in (A,B), except that the pipette solution contained 10 mM EGTA. (E,F) Same as in A-B, except that the pipette solution contained 2 mM BAPTA. Red arrows indicate the time of pulse stimulation.

Acknowledgments
This image is the copyrighted work of the attributed author or publisher, and ZFIN has permission only to display this image to its users. Additional permissions should be obtained from the applicable author or publisher of the image. Full text @ Cells