IMAGE

Figure 4

ID
ZDB-IMAGE-231016-21
Source
Figures for Shrestha et al., 2023
Image
Figure Caption

Figure 4

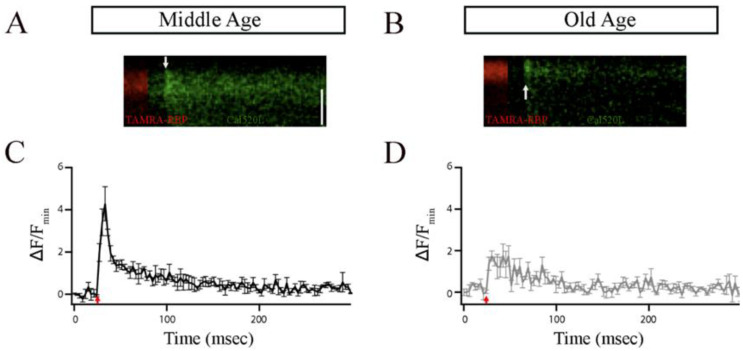
The ribbon synapses in the Mb1 bipolar cells from older-aged zebrafish exhibited altered Ca2+ responses after brief depolarization. (A,B) The x-t plots show the Cal520LA fluorescence intensity (green staining in the right section of each plot) at a single ribbon location as a function of time (horizontal axis); RBP-TAMRA fluorescence (red staining in the left section of each plot) indicates the position of the ribbon along the scanned line, while the darker region at the top of each plot is the extracellular space. White arrows indicate the timing of depolarization. (C,D) Spatially averaged Cal520LA fluorescence as a function of time at Mb1 bipolar cell ribbon from middle-aged (MA; panel (C)) or older-aged (OA; panel (D)) zebrafish. Shown is the average intensity (±SEM) in each horizontal row of pixels for three separate 10 ms depolarizations with similar calcium currents (41 ± 4 pA; n = 3 cells; three fish). Fluorescence intensity was normalized by the baseline fluorescence before stimulation by averaging over all pixels (i.e., over space and time) and dividing by the baseline fluorescence (Fmin). The red arrow indicates the onset of the 10 ms depolarizing stimulus.

Acknowledgments
This image is the copyrighted work of the attributed author or publisher, and ZFIN has permission only to display this image to its users. Additional permissions should be obtained from the applicable author or publisher of the image. Full text @ Cells