IMAGE

Figure 5

ID
ZDB-IMAGE-231011-7
Source
Figures for Ernst et al., 2023
Image
Figure Caption

Figure 5

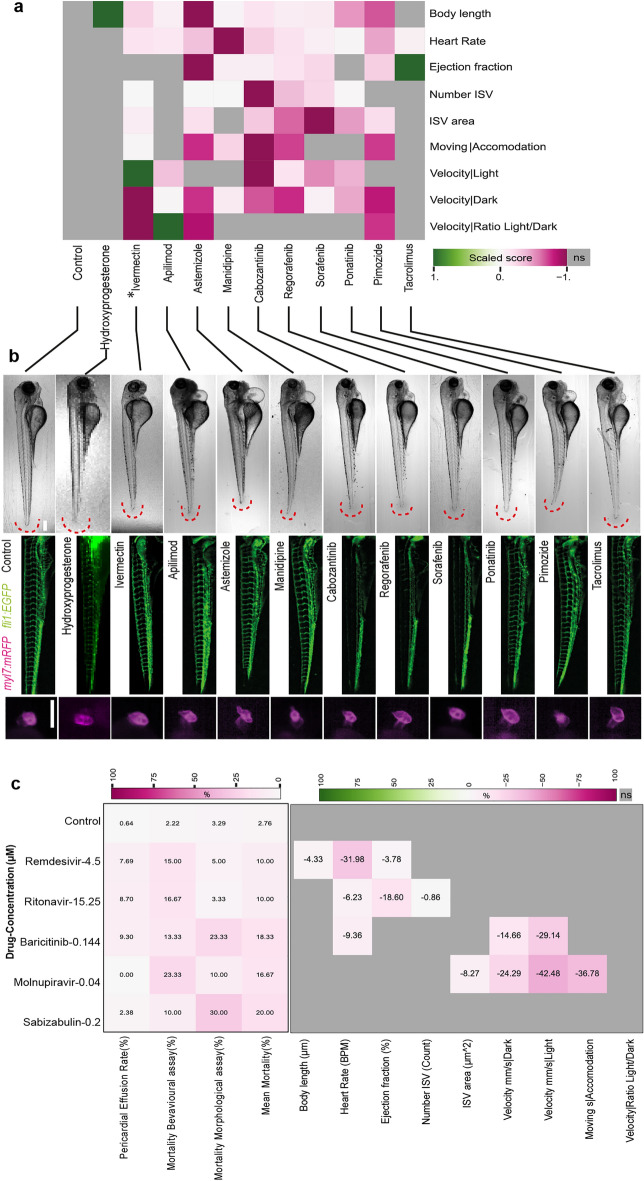
Selection of specific compounds eliciting effects on zebrafish embryonic development. (a) Results of 11 drug treatments leading to strong phenotypic alterations. Heatmap showing the highest positive score in dark green and the lowest negative score in dark magenta. Each measurement is individually scaled. Grey color indicates no significance according to the Mann–Whitney U test. Shown are the mean values from at least two technical replicates, each replicate is composed of at least 10 embryos per condition. Boxplots with individual data points for the morphology assay can be found in Fig. 4. (b) Example images of the control and treatments with visible effects are shown in brightfield, vasculature Tg(fli1:EGFP) and heart Tg(myl7:mRFP). Brightfield and GFP images are shown as sobel-projections. The dynamic range of GFP images was homogenized using the DEVILS Fiji-plugin. Scale bars: 250 μm. (c) Selected compounds at clinically relevant concentrations result in mild modulation of embryonic. A heatmap (left) showing percentage of pericardial effusion and mortality of the selected drugs at their clinically relevant concentrations. Mortality rates for morphological assay (with PTU) and behavioral assay (without PTU) are plotted separately followed by a column of mean mortality rate. Dark magenta shows the highest effect. The relative percentage effect of these selected drugs at their clinically relevant concentrations are shown in the heatmap (right). The highest positive effect is shown in dark green and the lowest negative effect is dark magenta. Grey color indicates no significance according to the Mann–Whitney U test. Shown are the percentage from median values from at three technical replicates for drugs except for Remdesivir, that was tested in two replicates, each replicate is composed of at least 10 embryos per condition during drug treatment.

Acknowledgments
This image is the copyrighted work of the attributed author or publisher, and ZFIN has permission only to display this image to its users. Additional permissions should be obtained from the applicable author or publisher of the image. Full text @ Sci. Rep.