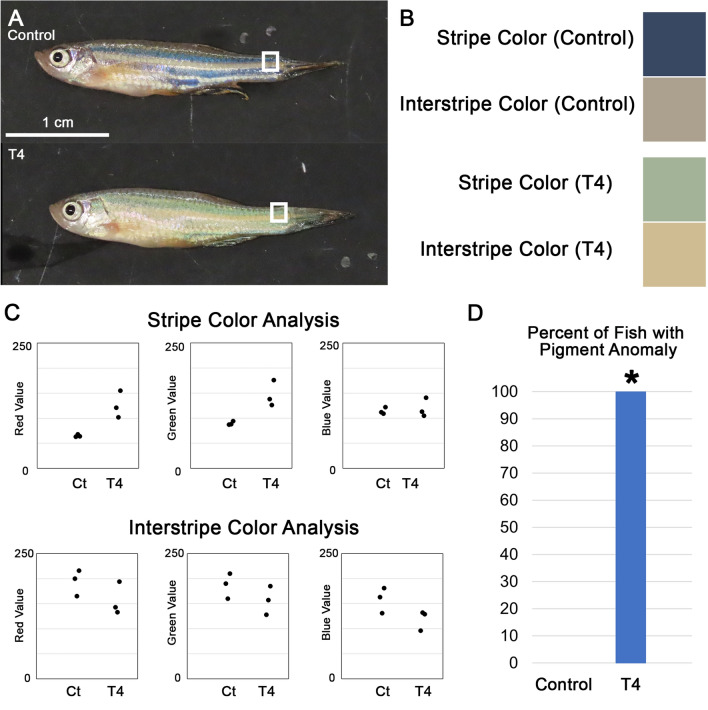
Five day T4 treatment of adult zebrafish alters skin pigmentation. (A) Brightfield photographs of representative fish. (B) Examples of representative stripe and interstripe colors of control and treated fish. Colors were sampled from regions denoted by rectangles in (A). (C) Color analysis of stripe and interstripe Red, Green, and Blue scale values, n = 3. Values denote “redness,” “greenness,” and “blueness” on a scale from 0 to 255. High red values indicate high redness. Low red values indicate green, low green values indicate red, low blue values indicate orange. Note trend of higher red and green values in stripes of T4-treated fish. (D) Percentages of fish in control and treated groups with altered pigmentation compared to untreated wildtype. All T4-treated fish showed altered skin pigmentation while all control fish showed normal pigmentation, p = 0.0143 (proportion test).
Acknowledgments
This image is the copyrighted work of the attributed author or publisher, and
ZFIN has permission only to display this image to its users.
Additional permissions should be obtained from the applicable author or publisher of the image.
Full text @ Sci. Rep.
Your Input Welcome
Thank you for submitting comments. Your input has been emailed to ZFIN curators who may contact you if
additional information is required.
Oops. Something went wrong. Please try again later.