IMAGE

Figure 4

ID
ZDB-IMAGE-231002-308
Source
Figures for Pietrobon et al., 2023
Image
Figure Caption

Figure 4

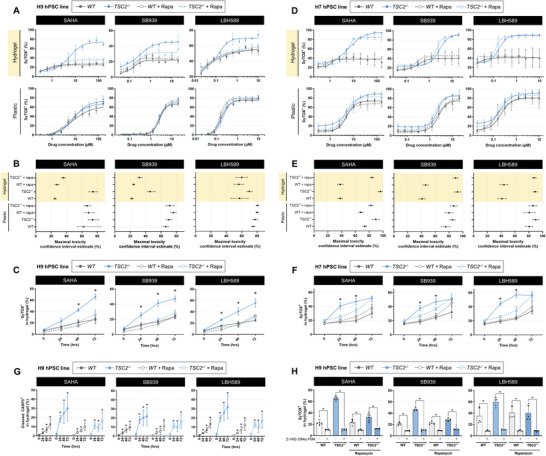
Three safe‐in‐human HDAC inhibitors induce mTORC1‐dependent selective cytotoxicity exclusively in hydrogel culture. A,D) Dose–response cytotoxicity curves of H9 (panel A) and H7 (panel D) cells treated with the indicated HDAC inhibitor for 3 days while cultured on plastic or hydrogel ± 20 × 10−9m rapamycin. Data fit via four‐parameter logistic regression (mean ± SD; n = 3). B,E) Confidence intervals of HDAC inhibitor maximal toxicity, estimated by four‐parameter logistic regression models generated in panels (A) and (D). C,F) Percentage of SyTOX+ cells following temporal HDAC inhibitor treatment (20 × 10−6m SAHA, 5 × 10−6m SB939, 1 × 10−6m LBH589) of H9 (panel C) and H7 (panel F) cells cultured in hydrogel ± 20 × 10−9m rapamycin (mean ± SD; * = p < 0.05 by two‐factor ANOVA with Bonferroni post hoc comparisons; n = 3). G) Percentage of cells expressing cleaved caspase 3 (CASP3), following 3 day treatment with HDAC inhibitors in hydrogel (20 × 10−6m SAHA, 5 × 10−6m SB939, and 1 × 10−6m LHB589, mean ± SD; * = p < 0.05 by two‐way ANOVA with Dunnett post hoc comparisons to 0 h for each group; n = 5–6). H) Percentage of SyTOX+ cells following 3 day HDAC inhibitor treatment (20 × 10−6m SAHA, 5 × 10−6m SB939, and 1 × 10−6m LHB589) in hydrogel ± 25 × 10−6m Z‐VAD (OMe)‐FMK (mean ± SD; * = p < 0.05 by one‐way ANOVA with Bonferroni post hoc comparisons; n = 4–6).

Acknowledgments
This image is the copyrighted work of the attributed author or publisher, and ZFIN has permission only to display this image to its users. Additional permissions should be obtained from the applicable author or publisher of the image. Full text @ Adv Sci (Weinh)