
Figure 8—figure supplement 1.
- ID
- ZDB-IMAGE-230916-172
- Source
- Figures for Sahai-Hernandez et al., 2023
|
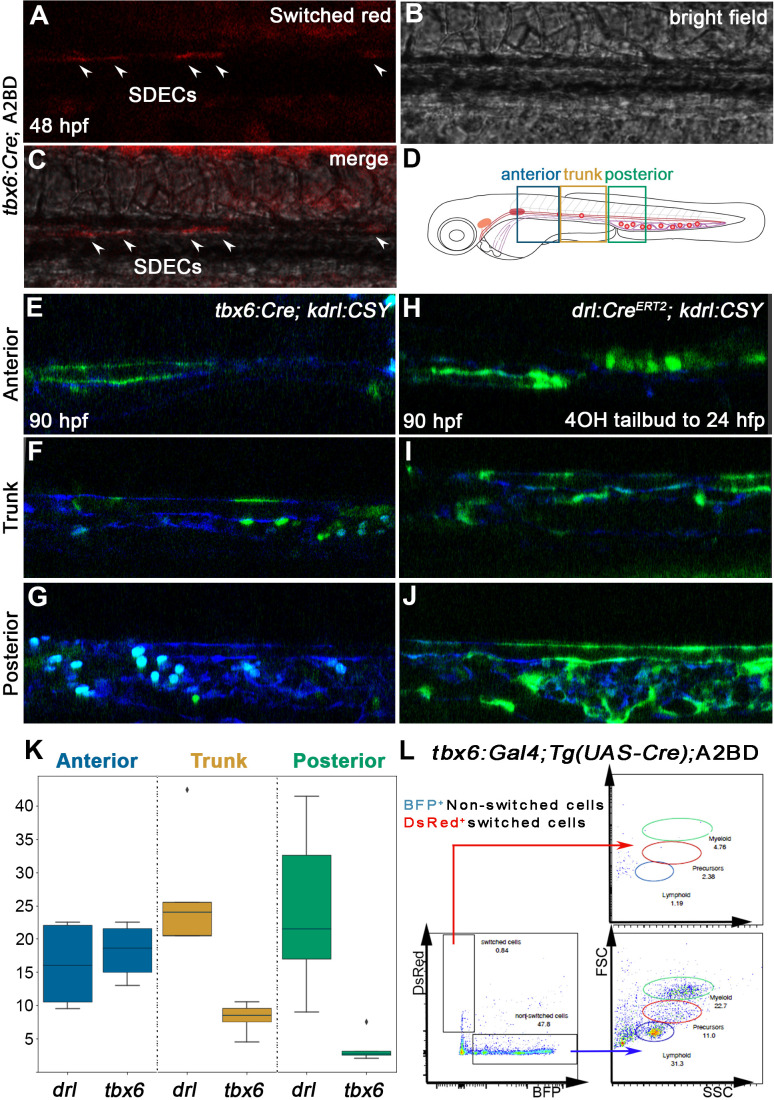
Figure 8—figure supplement 1. SDECs contribute to the dorsal aorta but do not generate HSPCs. (A–C) Lineage tracing of SDECs using tbx6:Gal4; Tg(UAS-Cre); A2BD shows dsRed+ cells in the vasculature region at 48 hpf (arrowheads). (E–J) Using a vasculature-specific switch line TgBACkdrl:LOXP-AmCyan-LOXP-ZsYellow (referred to as kdrl:CSY), we observe the contribution of SDECs or LPM-derived endothelial cells to the vasculature. (E–G) For SDEC labeling, a PM-specific driver tbx6:Gal4; Tg(UAS-Cre) was used. PM-derived YFP+ SDECs are observed in the vasculature of imaged embryos. (H–J) For LPM-specific EC labeling, a Tg(drl:CreERT2) was used and treated with 10 µm tamoxifen starting at 8 hpf. YFP+ ECs are observed in all regions of the vasculature. (K) Quantification of YFP+ SDECs and ECs from tbx6 or drl switched embryos, respectively. Quantifications were based on independent experiments per transgenic background with n=23 for tbx6 switched embryos and n=9 for drl switch embryos. (L) Analysis of the adult kidney marrow of tbx6:Gal4; Tg(UAS-Cre); A2BD animals shows no contribution to hematopoietic cells from switched DsRed+ SDECs through flow cytometry analysis, whereas the FSC/SSC distribution of the unswitched BFP+ ECs corresponds to all blood lineages (quantifications based from independent experiments with a total of n=21 samples). SDECs, somite-derived endothelial cells.