Image
Figure Caption

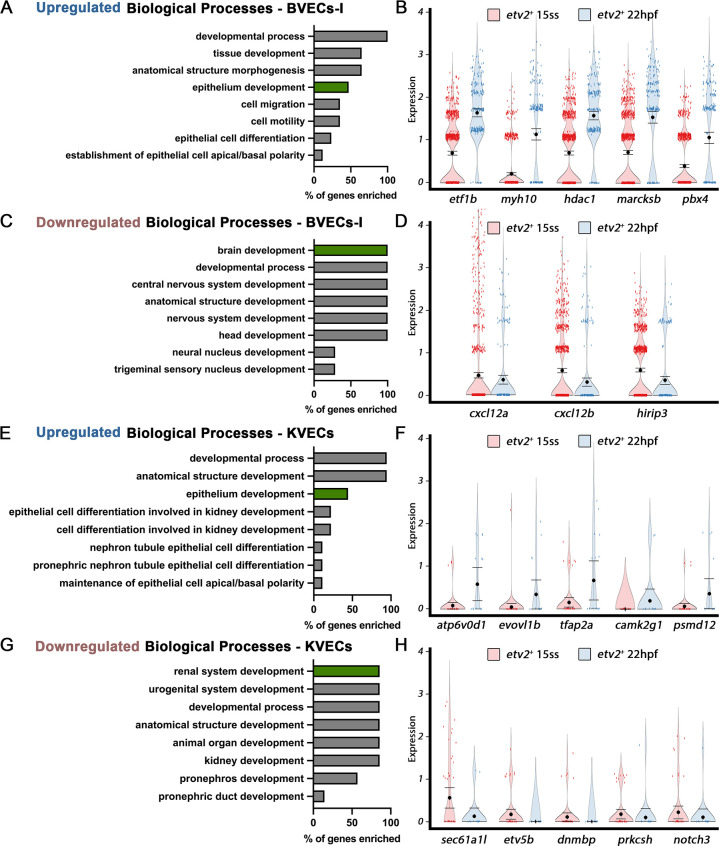
Figure 2—figure supplement 1. Differentially expressed genes between early and late ECs in BVECs-I or KVECs clusters highlight an early commitment to EC fate.

(A–D) Comparison of expression patterns of EC populations from early TgBAC(etv2:Kaede)ci6 15 ss and later 22 hpf etv2:Kaede+ ECs in the 63 overlapping genes between the BVECs-I transcriptome data and the AmiGo brain annotated genes. (A,B) Representative genes upregulated in the mixed vasculature 22 hpf samples compared to the 15 ss sample (B) and their suggested role in epithelium development, according to GO biological processes (A). (C,D) Representative genes downregulated in the mixed vasculature 22 hpf samples compared to the 15 ss sample (D) and their suggested role in brain development and neurogenesis, according to GO biological processes (C). (E–H) Comparison of expression patterns of EC populations from early TgBAC(etv2:Kaede)ci6 15 ss and later 22 hpf etv2:Kaede+ ECs in the 32 overlapping genes between the KVECs transcriptome data and the AmiGo kidney annotated genes. (E,F) Representative genes upregulated in the mixed vasculature 22 hpf samples compared to the 15 ss sample (F) and their suggested role in epithelium development, according to GO biological processes (E). (G,H) Representative genes downregulated in the mixed vasculature 22 hpf samples compared to the 15 ss sample (H) and their suggested role in renal system development, according to GO biological processes (G).

Acknowledgments
This image is the copyrighted work of the attributed author or publisher, and ZFIN has permission only to display this image to its users. Additional permissions should be obtained from the applicable author or publisher of the image. Full text @ Elife