
|
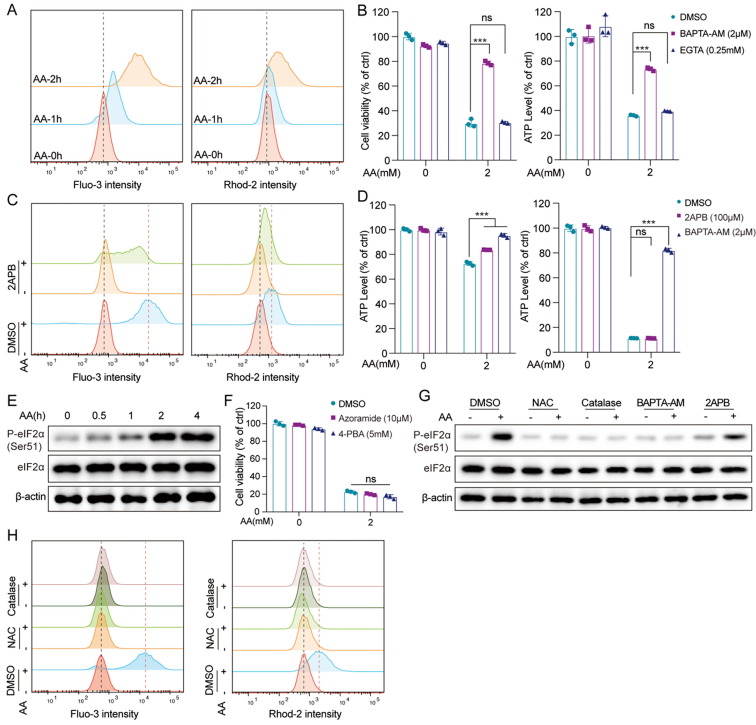
Fig. 3 AA induced Ca2+-mediated cell death. (A) A549 cells were treated with AA (2 mM) for indicated times, then intracellular (left) or mitochondrial (right) Ca2+ were detected with flow cytometry. (B) A549 cells were treated with AA (2 mM, 4 h) with or without pretreatment of BAPTA-AM or EGTA, then washed with PBS. After 20 h, the MTT (left) or ATP (right) assay was performed. (C) A549 cells were treated with AA (2 mM, 2 h) with or without pretreatment of 2APB (100 μM), and intracellular (left) or mitochondrial (right) Ca2+ was detected with flow cytometry. (D) A549 cells were treated with AA (2 mM) for 2 h (left) or 24 h (right) with or without pretreatment of BAPTA-AM or 2APB, and the ATP level was detected. (E) A549 cells were treated with AA (2 mM) for indicated times and P-eIF2α, eIF2α were detected. (F) A549 cells were treated with AA (2 mM, 4 h) with or without pretreatment of azoramide or 4-PBA, then washed with PBS. After 20 h, the MTT or ATP assay was performed. (G) A549 cells were treated with AA (2 mM, 2 h) with or without pretreatment of NAC (5 mM), catalase (2000 U), BAPTA-AM (2 μM), or 2APB (100 μM), respectively, and P-eIF2α, eIF2α were detected. (H) A549 cells were treated with AA (2 mM, 2 h) with or without pretreatment of NAC (5 mM) or catalase (2000 U), and intracellular (left) or mitochondrial (right) Ca2+ level was detected with flow cytometry. β-actin served as the loading control. **p < 0.01. ***p < 0.001.