IMAGE

Figure 5

ID
ZDB-IMAGE-230814-9
Source
Figures for Krylov et al., 2023
Image
Figure Caption

Figure 5

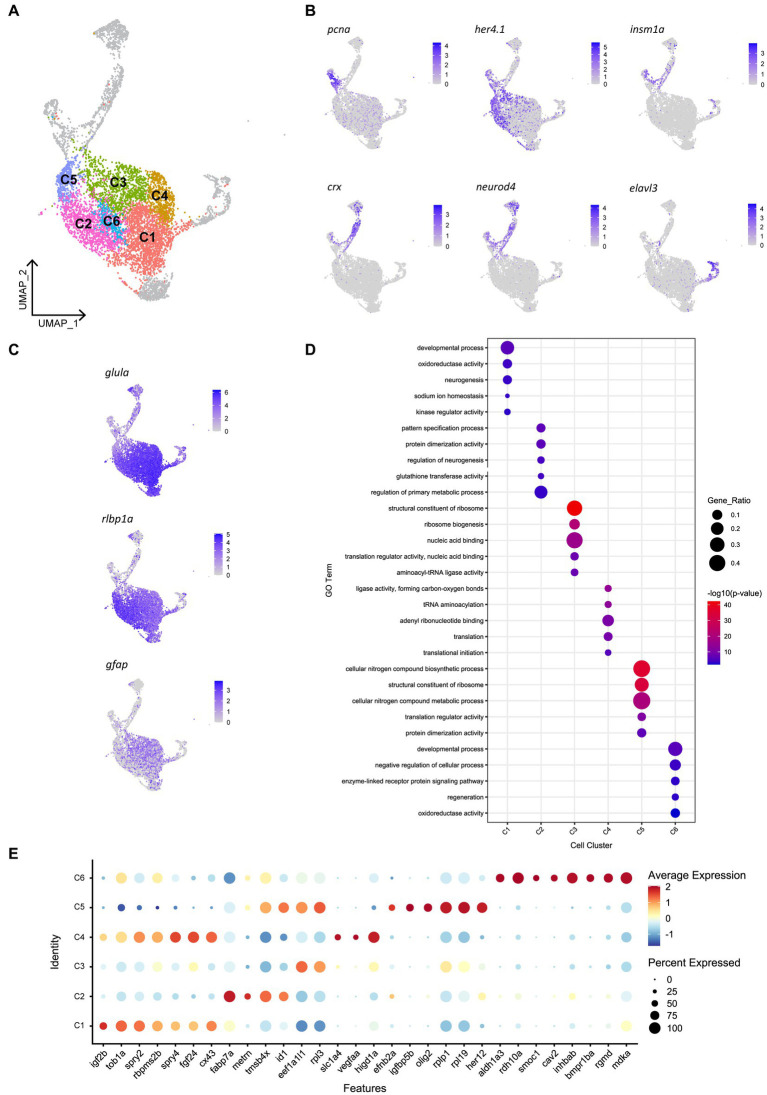
Heterogeneity exists in Müller glia of the uninjured zebrafish retina. (A) UMAP of FACS Müller glia and Müller glia-derived cells from the uninjured zebrafish retina at 9 days post-fertilization (dpf), revealing six clusters of quiescent Müller glia (C1-C6). (B) Expression plots of proliferating (pcna), immature cells (her4.1 and igfbp5b), and differentiating neurons (crx, neurod4 and elavl3). (C) Expression of mature Müller glia markers in the identified quiescent Müller glia. (D) Enrichment term analysis summarized as 5 gene ontology (GO) terms for each clusters C1-C6. Circle size depicts the gene ratio and circle color depicts the adjusted negative log p-value of significance. (E) Expression of top genes across clusters C1–C6. Circle size and circle color represents percentage of expressing cells per cluster and average log-fold expression value, respectively.

Acknowledgments
This image is the copyrighted work of the attributed author or publisher, and ZFIN has permission only to display this image to its users. Additional permissions should be obtained from the applicable author or publisher of the image. Full text @ Front. Mol. Neurosci.