IMAGE

Fig. 1

ID
ZDB-IMAGE-230814-262
Source
Figures for Zhong et al., 2023
Image
Figure Caption

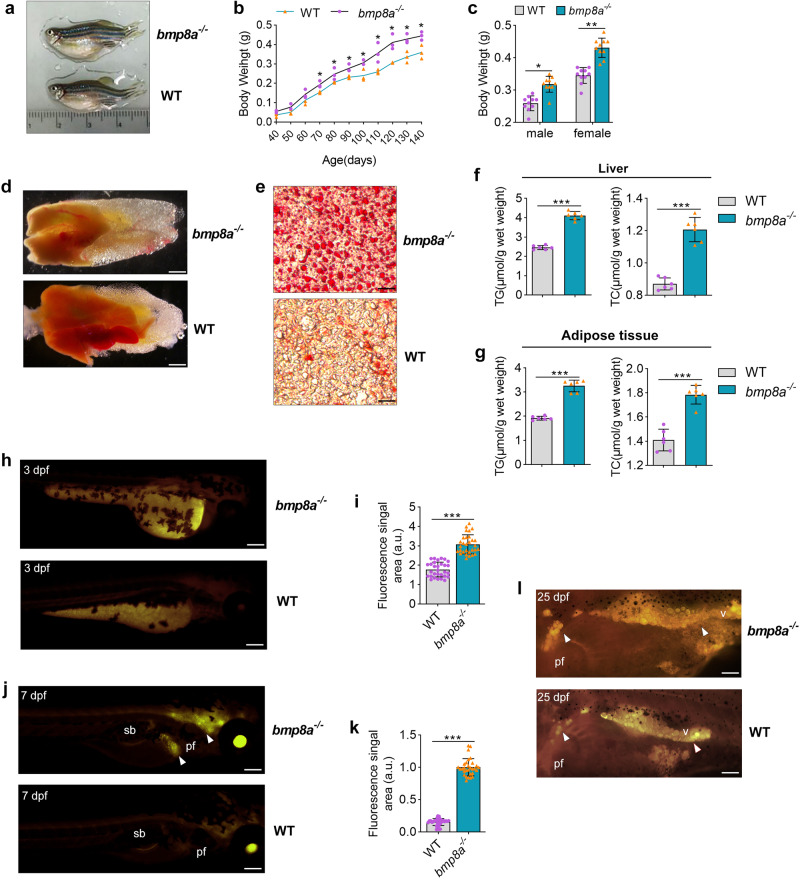
Fig. 1 Obesogenic phenotype of bmp8a-/- zebrafish.]

a Representative photograph of WT and bmp8a-/- zebrafish (n = 10). b Body weight changes of WT and bmp8a-/- zebrafish (n = 30). c WT and bmp8a-/- (male or female) zebrafish body weight at 140 days (n = 10). d Representative photographs of WT and bmp8a-/- zebrafish visceral mass (n = 6). Scale bars = 1 mm. e Fatty liver changes were revealed by histopathological sections (n = 6). Scale bars = 20 μm. f, g The TG and TC level in WT and bmp8a-/- zebrafish (f, n = 6) or adipose tissue (g, n = 6). hk Representative photographs WT and bmp8a-/- zebrafish at 3 dpf (h, i, n = 30) or 7dpf (j, k, n = 30) were stained with Nile Red. Scale bars = 300 μm. The fluorescence signal area was calculated by ImageJ software. l Representative Nile Red staining images of WT and bmp8a-/- zebrafish at 25 dpf (n = 10). Scale bars = 300 μm. Swim bladder (sb), pectoral fin (pf), viscera (v). Data were representative of at least three independent experiments. Data were analyzed by two-tailed Student’s t-test and presented as mean ± SD (*p < 0.05, **p < 0.01, ***p < 0.001).

Acknowledgments
This image is the copyrighted work of the attributed author or publisher, and ZFIN has permission only to display this image to its users. Additional permissions should be obtained from the applicable author or publisher of the image. Full text @ Commun Biol